27 January 2016

The Final Move: Fister Or Jackson?

by Jake Brintzenhofe

Jake Brintzenhofe contributes to our expanded roster freelance effort.  Feel free to email us with a sample article if you are interested in being a part of that.

By signing Chris Davis to his recent mega deal, the Orioles sent a message: the club is built to win. The contract was a mortgage on the future by saddling what is likely dead money five years down the line for the sole purpose of sustaining the competitive status of the team over the next two or three years. With more holes to fill, then what else can the club do during the back end of free agency? Rumors have the Orioles willing to spend as much as $15 million more on their payroll next year and two major holes to fill: one in the rotation and one in the corner outfield. Let us assume that to fit their budget, they are going to choose to fill one of these holes with a free agent at a salary in the $10 million per year ballpark. Two possible fits left on the market are Austin Jackson and Doug Fister – this article will examine which player would make more sense in Camden Yards.

Doug Fister
Steamer, Fangraphs’ projection model, projects that Fister will be worth 1.4 WAR next year. I like Steamer, but chose to also run my own projection using a weighted linear model and Baseball Reference’s similarity score feature. I used the ten most similar players to Fister and then weighted each of the ten’s contribution to the model based on how similar those players were to Fister. The ten players were Ray Washburn, Danny Cox, Mike Scott, Pat Zachry, Cy Blanton, Dutch Leonard, Dick Donovan, Craig Swan, Jack Kralick and Virgil Trucks. I was struck by the fact that these were old timers for the most part; we have not seen a player quite like Fister in a long time. It was also striking that their age 32 season’s WAR (Fister’s age next year) ranged as high as 6.9 and as low as -2.1; there really was not a cluster.

My projection ended up a bit less optimistic than Steamer at 1.235 WAR next year for Fister. This is a great time to say that a projection is different than a prediction. Projections are the average result of a range of outcomes – if our projection uses correct assumptions, it’s a coin flip for which side of it Fister lands on. While 1.235 WAR is a solid expected value, it’s likely that given the wide range of performances by the group we used to project Fister, he will fall on either side of it by a significant amount. There is a lot of possible variability. For the Orioles to succeed, they really need Fister to out perform that projection. To assess which side Fister would likely fall on, I took a look at his peripherals. The chart below describes several important numbers for predicting future performance.


 A few takeaways:
  • Fister’s fly ball rate and home runs per fly ball took a jump from 2013 to 2014 and stayed there in 2015. Fly balls account for the overwhelming majority of home runs. If fly balls are happening more often and leaving the park more frequently, that means A LOT more home runs allowed.
  • Fister’s line drive rate also took a jump. Line drives are bad for pitchers because they are difficult to turn into outs. Per Fangraphs, line drives result in a .685 average for hitters when they occur; given this, Fister will simply not be able to be effective if he continues to give up line drives at a high rate.
  • Fister’s fastball velocity has consistently declined for the last 5 years and 32 year old pitchers do not gain velocity back on their fastball. It’s highly likely that that velocity continues to drop and that hitters hit Fister more often with more hard contact going forward.
It is worthwhile to consider whether or not Fister’s declining performance the last two years is due to misuse after his move from Detroit to DC as many have suggested. This is certainly a possibility, but Fister’s fastball should be independent of this switch; its decline points more to Fister just getting worse at baseball .

Austin Jackson

Steamer projects that Jackson will be worth 1 WAR next year. I used the same weighted model system as explained above and got a projection of .863 WAR next year for Jackson. The ten players used were Brian McRae, Jim Piersall, Marquis Grissom, Gerardo Parra, Augie Galan, Al Cowens, Coco Crisp, Bobby Tolan, Lenny Dykstra and Johnny Groth. This group is significantly more modern than that of Fister and was much more consistent with performance. While their range went from -1.1 WAR up to 4.4 WAR; they were mostly between -1 WAR and 1.5 WAR.
Just as with Fister, I took a look at Jackson’s peripherals to see if we could learn anything about which side of the projection he’ll likely fall on.


A Few Takeaways · Other than a possible fall in line drive rate the last 3 years, there aren’t any clear trends in the data. · I took a look at Jackson’s splits versus lefties and righties and didn’t see an abnormal difference. As such, he doesn’t profile as a great platoon option. · Jackson has extremely high BABIP numbers; for a player of this age, that normally stays high until he ages and loses speed. Jackson being 29 next year means he probably has a few more years before this starts to steeply decline.

Recommendation:
Neither player inspires optimism for the type of big year the Orioles probably need to make themselves serious wildcard contenders. That said, if the Orioles are serious about contending next year, they need to make the savvy moves where they find a player who is going to really outperform his projection and thus his price.

On January 15, Jerry Crasnick reported that Fister was seeking a deal for 2 years and $22 million. I couldn’t find any reports on a possible contract for Jackson, but he played on a 1 year $7.7 million deal last year – it’s reasonable to think he would take a similar deal this year. While this isn’t exactly a scientific comparison, it’s fair to assume that Jackson will come a bit cheaper than Fister will. I can’t get past Fister’s fastball velocity decline or his increasing propensity to give up home runs; I see him as a bad gamble. This is especially true given that Camden Yards was the second most home run friendly park in baseball last year.

Jackson on a cheaper one year deal with little risk makes more sense. While his peripherals are all over the road, their randomness makes it hard to say for sure that he’ll decline. He was a plus defender last year and could give the Orioles outfield depth that they have sorely missed the last several years. I wouldn’t expect much more than 1 WAR, but it appears far more likely that he out does this number than that Fister does. If I were the Orioles GM, I would offer Jackson a one year deal to play at Camden Yards, the third best park for run production in the MLB last year, and maybe earn himself a big contract next offseason.

26 January 2016

Where MLB Receives Its Revenue

Recently, there was an article in Forbes claiming that MLBs Revenues were $9.5 billion in 2015. This is interesting information, but doesn’t explain much detail. Does MLB receive the majority of its money via media deals, attendance or maybe merchandise? Furthermore, there are certain categories of revenue that are split evenly between all thirty teams such as licensing fees, national media payments and MLBAM revenues and there are certain categories of revenue that are kept by the team that earned them (even if they are subject to revenue sharing). How much of MLBs revenue is in each of these categories and how does that impact free agent spending?

In 2010, Deadspin received financial documents that discussed the amount and where certain teams received their revenue. The categories were the following: gate receipts – otherwise known as ticket sales, concession sales, broadcasting revenue – including both local and national media deals, sponsorship and advertising, merchandise and MLBAM.  These are largely the areas where MLB receives its revenue.

Likewise, in 2004, when Deloitte prepared a document discussing how the creation of the Nationals would impact the Orioles, they noted six areas where the Orioles would be impacted. These areas were attendance, broadcasting, concessions and novelties, premium seating, future naming rights and advertising.

MLB had roughly 73,760,000 fans attend a regular season game in 2015.  The average standard ticket cost $28.94 in 2015 while the standard premium ticket cost $96.84. If 13.7 percent of tickets are premium and 86.3 percent are standard, then MLB would earn roughly $2.8 billion via gate receipts. This revenue is subject to revenue sharing but is kept by the club that earns it.

The MLB Fan Cost Index also predicts each fan to spend roughly $24 in concessions and novelties on average including programs and parking. For all 73.8 million fans, this comes out to $1.75 billion. However, not all concession money goes to the MLB clubs themselves. Some of this cash goes to the state and the companies that actually sell the concessions. The document from Deloitte discussing the Orioles 2004 revenue suggested that for each $5.40 that the team earned from ticket fees, they earned $1 from concessions. The documentation from Deadspin suggests that in 2008, the ratio decreased to roughly 5 to 1. Presuming that this ratio remains accurate, it’s reasonable to presume that MLB earned roughly $560 million via concessions and novelties. This revenue is subject to revenue sharing but is kept by the club that earns it.

These numbers don’t include postseason revenue. While some postseason revenue goes directly to the players, the rest goes to the Commissioner’s office and the teams themselves. It is reasonable to presume that MLB earns another $100 million in postseason gate receipts and concessions. Much of this revenue is subject to revenue sharing but is kept by the club that earns it.

Fangraphs claims that the national TV contracts, pay MLB $12 billion from 2014-2021. Presuming a standard 4% increase per year, then MLB would have received roughly $1.35 billion for its national TV rights in 2015 split equally among each team. In addition, MLB Network’s subscriber revenue is predicted to be $222.5M and probably earns over $250M in revenue when taking advertising revenue into account. Any profit earned from this revenue is split amongst each team equally.

Teams also earn cash from local TV media deals. In 2013, an article in Fangraphs listed terms for each teams’ local deals. All of these deals are certainly out of date. NESN may have paid the Red Sox $60M in 2013 but paid closer to $100M in 2015. Likewise, YES paid the Yankees $90M in 2013 but $98M in 2015 due to standard inflation.

On the other hand, other numbers are completely incorrect. MASN paid $36M in 2013 to both the Nationals and Orioles, but $42M in 2015 while Fangraphs claimed that MASN paid both clubs $29M in 2013. For some reason, Fangraphs decided that the Angels received $150M in media rights fees in 2013 based on a new media deal that doesn’t go into effect until 2016 and starts at roughly $60M with a 4% increase. Likewise, the Dodgers received $220M in 2015 compared to the $340M annual average value of their deal. Fangraphs made similar mistakes for the Astros, Rangers, Padres and Mariners deals resulted in them significantly inflating the value of local media rights.

Per Fangraphs, the total value of each of these local deals combined is $1.7B in 2013. However, after taking new contracts, inflation and errors into account, it is more likely that teams earned about $1.8B in 2015 from both cable and radio deals. Without knowledge of each media deal, it is impossible for me to do anything more than make an educated guess.

According to the MLB IEG Sponsorship Report, MLB earned roughly $778 million in sponsorship money in 2015. This is an increase from $700 million in 2014.  The Orioles were one of seven teams that had below average sponsorship revenues. Fortunately for the Orioles, sponsorship money is split between all teams equally regardless of the source.

The Baltimore Sun suggests that MLB had a total of $3.4 billion in merchandise sales in 2014. Forbes argues that MLB broke $3 billion in merchandise sales in 2015. In general, MLB merchandise sales have remained around $3 billion per year over the past ten years. Scott Sillcox from the Licensed Sports Blog suggests that MLB receives a royalty payment of 12% of the $3.4B in sales or roughly $400 Million that is split equally between all teams.  In addition, MLB receives an unknown amount of licensing revenue from other sources.

MLBAM had revenues worth roughly $900 million in 2015 and has been earning a steady profit for MLB. Its revenues will likely take a hit as a result of the Garber settlement that forced it to offer single-team packages and reduce prices. This revenue is split equally amongst every team.

This comes out to roughly $9 billion compared to Forbes’ projected revenue of $9.5 billion. Some of the difference is due to other minor categories, while other differences are due to different methodologies.

In this article, Forbes creates a graphic that shows from which categories MLB earned $8 billion of its revenue in 2015. It ignores the $800 million earned via MLBAM, as well as another $200 million from other areas such as the all-star game where they claim money doesn’t filter down to the teams.

Their graphic looks like this:


My graphic looks like this:


Using this data and basic multiplication, it is possible to create a graph that shows where my calculations and Forbes calculations differ (numbers in billions).


There’s not much of a difference. My results have slightly higher attendance revenue and local media revenue, which is probably due to standard inflation. Prices increased from 2014 to 2015. Their results have slightly higher national media revenue, sponsorships and licensing fees. Their articles seem to indicate that they look at average media revenue as opposed to actual media revenue which would inflate their results. Their results also indicate that they’ve either been overestimating the amount of money MLB earns via sponsorships by over $100M or that the source I use is incorrect as well as potential differences in licensing. But, at minimum, our results are similar. This is a good sign given that we presumably didn’t use the same methodology and sources.

Gate receipts, premium seating, concessions, local media and postseason cash are subject to revenue sharing and are kept by the team that earns it, whereas national media, sponsorship, licensing, MLBAM and other revenue is not subject to revenue sharing and are split equally among each team. This is how the pie looks for revenue that is kept by individual teams and not shared equally for both Forbes 2014 numbers and my 2015 numbers.


Roughly 65% of unshared revenue comes from attendance while the other 35% comes from local media fees. This shows that while the amount of unshared revenue is increasing, it still lags far behind revenue from fans attending games despite the fact that the amount of total revenue earned via media (local, national and internet) is greater than that earned from attendance (gate receipts, premium seating and concessions).

The impact of media on MLBs revenue is considerably large. However, since most media revenue is split equally amongst teams, it has less impact on free agent spending than attendance revenue. It seems likely that attendance revenue will have more of an impact on free agent spending than media revenue until MLB is able to truly go international and convince people in Asia, South America and Europe to purchase their product.

25 January 2016

Orioles Are The Worst Team In The AL East

The title of this post comes from FanGraphs' current projection for the 2016 season.  The inspiration for this post comes from several tweets during the snowstorm asking for my perspective on where the Orioles are now and what exactly they can do to improve their situation.  Anyway, here are the FanGraphs projections:
Red Sox 91-71
Yankees 86-76
Blue Jays 84-78
Rays 82-80
Orioles 77-85
Now, you might wonder what that all means (which we kind of covered a couple years back).  In rough terms, those numbers show the typical result given the projected talent level of the rosters. These projection models perform roughly the same and we should think of the 77-85 figure as a 50th percentile outcome.  If we go out to one standard deviation (68% of all possible outcomes), then we are looking at 68-86 wins.  Therefore, we are looking at about a 16% chance at the team being Wild Card or better competitive and about 7% chance for a strong placement into the post season.

That said, I think there are a couple problems with the depth chart that FanGraphs is using.  The first issue is obvious: Hyun Soo Kim is not on the board.  The second is slightly less obvious, but still notable: they have the Orioles as insisting upon using Jimmy Paredes at DH even though he is below replacement value there.  I doubt Duquette has much loyalty to Paredes.  In fact, I would be surprised if he winds up on the club on Opening Day.  Anyway, I will wander down the list and note where I think there might be a noticeable issue.  Then we will put it all together and see if our future might be brighter than it originally seems and perhaps where the couple may still be able to improve.

Overall
Here are the projections for each position for FanGraphs:
Catcher 3 WAR
First Base 3.4
Second Base 1.4
Third Base 5.3
Shortstop 1.7
Left Field 0.6
Center Field 3.1
Right Field 1.0
Designated Hitter -0.5
Starting Pitcher 8.8 (w/3 +1.5)
Relief Pitcher 3.7
As I mentioned above, left field looks to be an issue.  The current iteration has the following:
Nolan Reimold 385 PA 0.2 WAR
Mark Trumbo 140 PA 0.3 WAR
Henry Urrutia 105 PA 0.2 WAR
LJ Hoes 63 PA 0.0 WAR
Joey Rickard 7 PA 0.0 WAR
It is a glaring absence with Kim not being on that list.  If we take ZiPS' Kim rating of 1.1 WAR over roughly 550 PA and then add in 150 PA from Reimold and Rickard, a final position WAR comes in at 1.4.  That is a 0.8 win increase and every little bit helps.

Right field has issues related to the left field situation plus a peculiar selection at designated hitter.  As it stands, the suggested depth chart reports:
Mark Trumbo 350 PA 0.6 WAR
LJ Hoes 210 PA 0.1 WAR
Henry Urrutia 70 PA 0.1 WAR
Dariel Alvarez 70 PA 0.1 WAR
Although I would want him out there as little as possible, I could see Trumbo finding himself with 30-40 games in right field.  It would be similar to a Nelson Cruz situation where the club gives Trumbo an occasional start in the outfield, but then finds him there a little more often than planned.  In the end, I could see Trumbo having about 150 PA in RF with Reimold and Alvarez filling out the rest of the 550 PA.  I do not see the new arrangement meaningfully pushing the needle here.

Designated hitter is the other major head-scratcher simply because the depth chart suggests that the club will repeatedly send Jimmy Paredes to the position even though it projects him to fail grandly at playing the position.
Jimmy Paredes 385 AP -0.7 WAR
Christian Walker 245 PA 0.1 WAR
Mark Trumbo 70 PA 0.1 WAR
Trumbo will likely see around 400 PA at designated hitter.  He alone should see around a 1.0 WAR. Other position players pulling in a few plate appearances here should add another 3 or 4 runs to the mix.  Overall, the -0.5 WAR should actually be about a 1.5 WAR.  This, alone, is a two win increase.

Improvements
As it stands, the above corrections push the club to the 80 win mark.  However, there is considerable weakness in the starting rotation with only three starters projected above a 1.5 WAR and slightly weak performances from the corner outfield, designated hitter, and second base.  With perhaps at most 15 MM available in the budget, player acquisition might be a troublesome issue.

Trade
Carlos Gonzalez (1.7 WAR over 525 PA)
As was written a few days ago, Gonzalez is a fringe first division outfielder.  He has the ability to play a respectable, but not thrilling, right field.  His inclusion would raise the positional projection from about 1.0 WAR to 2.0 WAR (overall wins to 81).  At 17 MM in 2016 and 20 MM in 2017, Gonzalez will be difficult to fit under the payroll.  Perhaps, the Rockies would be willing to swallow 2-10 MM for 2016 with the Orioles shouldering the full contract in 2017.  The Orioles may be able to include a player like Vance Worley or Miguel Gonzalez to help reduce salary obligations as well.  It may enable the Orioles to also go after a pitcher such as Mat Latos or Yovani Gallardo who would increase a win as well (82 total).

Free Agency, Losing a Pick or Two
Howie Kendrick (2.4 WAR over 545 PA)
This is a bit of a curveball suggestion.  As it is, STEAMER doubts Jonathan Schoop will build off of his offensive breakout last year and instead will produce a .307 wOBA.  Kendrick would add another win to the projection.  Schoop would then be shifted out to Right Field.  He has the arm for the position, but he has never played there and his range in questionable.  Kendrick would also provide the club the flexibility to put Schoop at third base if Manny Machado has to replace J.J. Hardy at Shortstop.

Kendrick will require the club to lose a draft pick as he has a qualifying offer on him, so a three- or four-year deal may be preferable.  Kendrick has experience at first base, second base, and a tad bit in left field, so he may give some flexibility in the coming years depending on the team needs.  A multi-year deal could potentially be back-loaded to provide more flexibility to 2016 in order to fit a pitcher like Latos or Gallardo onto the roster.  This is another option that tacks on a couple wins.

Free Agency, Keeping the Picks
The only big moves that can be accomplished without losing draft picks would be to go in deep with bounceback candidates in the starting rotation.  In this scenario, the club would sign Doug Fister to a back-loaded two-year contract and Mat Latos to a one-year deal.  Bumping Miguel Gonzalez, Tyler Wilson, and Mike Wright to another team, Norfolk, or the bullpen would give the club a couple projected wins as well.

What Does 82 Wins Get You?
Moving from 79 to 82 projected wins does not seem like much of an increase, but it pushes the needle from about a 7% sure appearance in the playoffs to about 16% (again, this is based on past projections and where clubs wound up).  It also pushes meaningful late September baseball from around 16% to 35%.  Those are rather considerable jumps.  The question then becomes which route is best?  Losing a mid-level prospect and shouldering a major cost in 2017 to get Carlos Gonzalez.  Or, maybe, punting important picks in the draft to secure a "proven" veteran like Howie Kendrick or Yovani Gallardo.  Or, perhaps, rolling the dice on bounceback starting pitchers with hope that there still is something left in the tank or that makeup issues are overblown.

23 January 2016

How A Day Off Affects Catchers


The 2016 Orioles are cursed (blessed?) with two catchers worthy of starting roles on Major League teams. While having a deep roster at one position is always a blessing, the Orioles suffer from the employment of both Matt Wieters and Caleb Joseph thanks to their salaries complicating resource allocation and because only one can be on the field at a time.

There was a longshot opportunity for Wieters to play first while Caleb Joseph served as the primary backstop, but that was eliminated when Chris Davis signed a long term deal to stay in Baltimore. Wieters and Joseph may each get some DH duties, but neither is ideal for the role - I'm sure most people would like to see better pure hitters playing the only position for pure hitters. Most often, I would expect to see one playing while one gets a day of rest, typically assumed to be a good thing, particularly for catchers.

For health, regular days off may be ideal for players in arguably the sport's most demanding position. At the plate, rest may be ineffective at best and detrimental at worst.

To test this (actually, with the thought that rest was good for plate performance),  I gathered all events from 2003 to midyear 2013 that featured a catcher holding a bat. I got rid of any player that didn't meet a very generous 100 at bat threshold so that emergency catchers and September call-ups wouldn't affect the final results. Then, according to the date of the event, I determined which happened in a game following at least one day of rest and which happened in a game following a game in the immediately preceding day. This reflects the fact that catchers can get rest from normal days out of the lineup, days in which the team is not playing, the entire offseason, and - unfortunately - injury.

Rehabbing injuries, while technically time away from baseball, are a special kind of rest because they aren't really rest at all. Rehab is a ton of work, often painful, and many players are affected by injury in the first few games that they come back and recapture their routine. Injuries have the ability to adversely affect offensive productivity when the player returns to action, so it's worth noting that the final results of my analysis could, but are not necessarily, affected by the circumstances surrounding them.

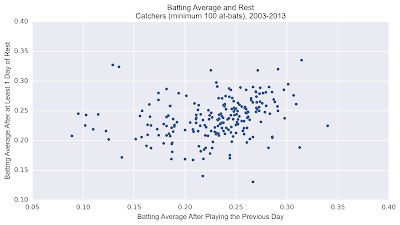
The following chart shows how catchers have batted in a game following a day of work plotted against how catchers have batted in a game following a day of rest:


There's a pretty solid correlation between batting average and batting average after a day of rest; good hitters are always good hitters, and rest doesn't make a bad hitter a good one. But we're interested in whether a day of rest adds a boost to a hitter regardless of given quality.

One thing to keep in mind regarding the Orioles' situation is that having a significant timeshare is very unusual. The vast majority of games played after a day of rest were played after a day of rest:
That's generally consistent with the thought that most teams don't have two catchers worth significant time. Really, it's hard enough to find one player who is competent at both the plate and behind it, or is competent enough in one area to make up for deficiencies in the other. It seems most catchers have one day off, whether a scheduled day off or a simple day of rest, and then get back to action. If Wieters and Joseph split the season, say 100/60, they'll both be seeing more than one day of rest at a time fairly often.

And therein lies another potential pitfall with the final results of this analysis: good catchers rarely get rest, so the offensive productivity of catchers after time off is driven equally or possibly mostly by second-tier catchers who either back someone up or aren't good enough to take the job full time.

In five statistical tests with a random sampling of catchers (21 catchers in each sample) with at least 100 at bats, the difference between their batting averages after rest and their batting averages overall is generally too small to be statistically significant. In the roughly 15% of samples that the difference is found to be statistically significant, it's because the catchers are batting so poorly after a day of rest.

When testing is applied to the population of catchers, the batting average of catchers on days of rest is so far below the rest-independent average of the same population, it is statistically significant at the alpha=0.95 level.

These tests indicate that catchers tend to do worse after days of rest, but that their performance in many cases may be a result of random variance - that they could just as easily be getting hits as they are getting out. Other catchers are really hampered by a day off, possibly breaking a rhythm, coincidentally (or not, if managers elect to play backups against a weak starter in favor of rested regulars against aces the following day) seeing great pitchers after a day of rest, or catchers regularly getting rest simply being worse players in general.

The same effect is seen in on base percentage, and is possibly even more pronounced. Players more frequently post high rates of getting on base when playing without rest. Perhaps better players play without rest more often, but also consider that a player might need a few days to get a good sense of the strike zone, or get into a rhythm at the plate:

As with batting average, I conducted statistical tests on the on-base percentages of five separate 21-observation samples of catchers. The difference between catchers' ability to get on base after a day of rest was found to be statistically significant at the alpha=0.95 level in roughly 30% of samples. Again, the difference in OBP between players' averages and their performance after days of rest was found to be significant negatively; catchers do worse (if they do worse) after a day of rest.

Because the results were not particularly conclusive, I conducted the same tests on the population of catchers as I did with batting average. And again, the likelihood that the difference in rest OBP and overall OBP in the population was minuscule; as a whole, catchers are worse after rest.

Whether these results are directly applicable to the anticipated Wieters/Joseph timeshare is up for debate. Arguably they are both better catchers than the majority of catchers seeing days off often throughout the season. However, catchers generally tend not to do well after a day of rest - surprising, considering the possibility of healing, relaxing, and studying on a day off.

For what it's worth, I accept the proposition that catchers are marginally worse after a day of rest, perhaps not as noticeably as the full population suggests. That leaves me either hoping that Joseph and Wieters are possibly unusual cases that see no detrimental effects from rest, or, as has been my position since Wieters accepted the Orioles' qualifying offer, that the Orioles would use their depth at the position to allow for trading one of the two in exchange for filling other areas of need. In addition to filling roster holes, moving forward with one true primary catcher may generate better performance from the catcher position over the course of the 2016 season.

Filling Holes With Mancini

With Chris Davis in the fold for the next seven years, the Orioles now find themselves with a young, promising player who has turned heads and is now effectively blocked: Trey Mancini.  Last year, Mancini broke away from being someone worth a flyer to impressing many scouts with his bat.  There are still questions as to whether his swing is too long, but his youth and improvement-to-date make many look past his current deficiencies.  As such, he is expected to crack into a couple top 100 minor league prospect lists.

The value of a backend top 100 prospect first basemen varies a bit, but a conservative figure is that such a player is worth about 12-15 MM.  The Orioles may be able to use this value to find themselves a right fielder or a starting pitcher to round out their rotation.  However, having a useful prospect does not mean teams are hanging around with MLB ready players to off load.  A club will have to both be in rebuilding mode and in need of a future first baseman.  The two clubs that come immediately to mind are the Milwaukee Brewers and the Colorado Rockies.

When evaluating the future performance of players, I used a simple approach instead of the comp model approach.  I took STEAMER's 2016 projected WAR and then moved forward with an age curve.  Until age 27, an increase of 0.25 WAR per year.  From 27-30, no change in WAR.  From 31-37, a decrease of 0.5 WAR per year and past 37, a decrease of -1 WAR per year.

Right Fielder
Rockies
With the signing of Gerardo Parra, giving the Rockies too many outfielders, and the media leaks that the club is looking hard at available starting pitching, the Rockies curiously appear to be trying to make a push for playoff relevance.  While their farm system is bereft of an obvious first baseman of the future, therefore, giving them a reason for wanting someone like Trey Mancini; they may prefer more MLB ready talent.  With that in mind, Mancini could provide two useful things: salary relief or as a promising second piece in a package.

The player the club would obviously want to dismiss is Carlos Gonzalez.  The bat has slowed and the defense is not all that impressive, plus he is due 17 MM this year and 20 MM for 2017.  A fringe move would be someone like Charlie Blackmon who is set to make about 4.5 MM in his first year of arbitration.  Moving his salary would provide some payroll relief and a multiyear deal for a starting pitcher could be backloaded to take advantage of Gonzalez leaving in two seasons.  Corey Dickerson is the potential prize of the bunch as he has four more years of control in a package that is quite suitable for a second division outfielder.

WAR
Cost
Value
Carlos Gonzalez
2.9
37
-16
Corey Dickerson
6
22
24
Charlie Blackmon
5.8
27
16

The value of Mancini (12-15 MM) is nearly equivalent to what Blackmon could be expected to provide in value.  One would think the Rockies would want another piece that might be more relevant to their current roster.  It might be a stretch, but there might be some interest in pitchers like Vance Worley or T.J. McFarland who are not exceptionally meaningful on the Orioles roster.  Of course, this line of thought is more about Blackmon being sent out as a way to open up payroll as opposed to McFarland or Worley being of much value.  A 4.5 MM salary for 2016 for Blackmon, would likely provide the Orioles up to 10 MM to find themselves a starting pitcher bounce back option like Cliff Lee or Mat Latos.

The Rockies might push more for Mike Wright or Oliver Drake.  Wright should cause the Orioles to pause.  A Mancini and Wright deal for Dickerson would make more sense in terms of value for value, but the Rockies would have to think well of Wright as a starter because such a move would not immediately shed payroll.  If the Rockies really adore Wright, this might be the ideal move for both sides.

Carlos Gonzalez is the obvious move here, but the swing in value between him and Mancini is 30 MM.  A piece would have to accompany Gonzalez in that deal.  A piece like David Dahl, which would be an obscene desire to vacate Gonzalez' salary.  A more reasonable deal would be Mancini for Gonzalez (with money coming from Colorado: 4 MM this year and 10 MM in 2017) along with prospect 3B Ryan McMahon or OF Raimel Tapia.  A garnish like T.J. McFarland or Vance Worley would also make sense.  This deal would likely mean that whatever the Orioles' solution to pitching is, it will be internal.

Starting Pitcher
Brewers
The Brewers are in a difficult situation as was explained earlier here by Ryan Romano.  Their attempt to play out the string imploded in a way Orioles fans might recall from 1998 and 1999.  This has placed the team in a position to cash in chips and think about building toward two or three years down the line.  As it is, the club has no ideal first baseman of the future.  The club has floated Ryan Braun around, but no serious discussions appear to have taken place.  Braun might sound interesting, but he is likely a 60 MM loss in value to anyone.  He no longer performs well in right field, but can play there short term.  He is more of a designated hitter these days.  The penalty for shifting to DH is about the same as his defense deficiency, so his overall value is likely the same at either position.  For the Orioles, he could play right this year and then move on to DH the next four.  A fair deal would be Braun plus 50 MM for Trey Mancini.  I cannot imagine they would be willing to sink that much money into a player who is not on their roster and only get a promising first base prospect in return.

More likely than sinking big money to bid their marqee player adieu, would be for the club to ticket some of their pitching for trade.  The Orioles, hungry for a right fielder, are also hungry to add to their starting rotation.  The Brewers have three likely options: Jimmy Nelson, Wily Peralta, and Matt Garza.  We will kindly not mention Zach Davies any further.

WAR Cost Value
Jimmy Nelson 10 32 45
Wily Peralta 4.8 20 16
Matt Garza 2.7 38 -18

Moreso than Corey Dickerson, Jimmy Nelson is probably a pipe dream for the Orioles.  Nelson is still in pre-arbitration and is of importance to the Brewers as he just might well be the experienced arm in the rotation by the time they are competitive again.  A deal for Nelson would probably look like something similar to Nelson in exchange for Jonathan Schoop and Trey Mancini with maybe Vance Worley as a placeholder arm.

Wily Peralta makes more sense for the Orioles to target.  He is a pitcher who likely will not be with the Brewers once they rebuild and provides decent depth for the Orioles.  Injury concerns lessen his value a little bit, so it might be reasonable to think that Peralta could be dealt straight up for Mancini.

Finally, Garza is who the Brewers would want to separate with.  He has 38 MM coming to him over the final three years of his contract and is coming off a disappointing 2015.  Similar to Carlos Gonzalez, the difference in value with Mancini to the Brewers is about 30 MM.  I think Garza is such a poor value that the Brewers would likely hold onto him to see if he bounces back and can be dealt without having to add money.  J.J. Hardy and him would make an easy pairing except that the Brewers are still working with Jean Segura at shortstop.  Maybe a deal of Garza and Segura for Hardy and a potentially useful young pitcher, like Tyler Wilson, would be of use.  I imagine Hardy would not be keen on such a deal, but it would grant him that third year.

Conclusion
Trey Mancini is a decent trade piece.  He is on the threshold of being considered a true prospect and has that sort of transitional value.  The Orioles, having signed Chris Davis, have limited use for Mancini who profiles as a genuine first baseman.  Mancini's bat would need to develop immensely to have a place at the MLB level for the club.  Therefore, it makes sense to repurpose that value for something the club needs.  Milwaukee and Colorado are two clubs that appear to be obvious fits for Mancini.

While Corey Dickerson or Jimmy Nelson would be the prizes from those clubs, they likely require a considerable amount of talent to depart to Baltimore.  More likely options, such as Charlie Blackmon and Wily Peralta, may have some obstacles in place that may make it difficult for the Orioles to acquire them for their true value.  Finally, obvious players who are available would be Carlos Gonzalez and Matt Garza.  Their pay does not match their contracts, so it may be a challenge for the Orioles to take on proper risk with them.

As it stands, Charlie Blackmon seems to me to be the best likely available option.  He has the ability to stand at all three outfield slots and provides a useful left handed bat to the lineup.  He suffers from a considerable split and is more or less a second division outfielder, but he would have some use and some cost control as he works through his three option years.

22 January 2016

Jason Garcia Finished Strong In 2015

Click here for Ryan Romano's archives.

For the fourth time in five years, the Orioles selected a player in the Rule 5 Draft. Joey Rickard will join the roster in 2016, along with previous selections Ryan Flaherty, T.J. McFarland, and Jason Garcia. Rickard has hit pretty well in the minors, but overall he doesn't seem like much. No matter what happens in the future, he almost certainly won't make the big-league club better this season.

This continues what has been, for now, a wholly underwhelming Rule 5 return for Baltimore. Flaherty has averaged 0.8 fWAR per 600 plate appearances in his career, while McFarland has amassed 0.8 fWAR across 173.2 innings of mostly relief. Both players, in other words, have played closer to replacement level than we'd like — and with horrid showings in 2015, both have trended in the wrong direction as of late.

Garcia, though, may have some potential. Although his 2015 results — sub-replacement level marks in both fWAR and rWAR — don't look that appealing, they bely the improvements that he made as the year progressed. In Year 2 as an Oriole (or, in all likelihood, as a Tide), he may build upon these further and take the next step in his development.

Before Garcia was good, he was bad. In his first eight games of the season, from April 8th against the Rays to May 10th against the Yankees, he gave free passes to 17.5 percent of the batters he faced and punched out 12.5 percent. That ugly combination, along with a 38.1 percent ground ball rate, left him with a 5.93 ERA and 7.67 FIP in 13.2 innings. Had he sustained those figures for much longer, he likely would have returned to the Red Sox on the waiver wire.

In a mixed blessing, Garcia went on the 15-Day Disabled List on May 13th with shoulder tendinitis. A month later, the Orioles transferred him to the 60-Day DL, to make way for Mychal Givens. His recuperation took three months, allowing him to reappear on August 7th against the Angels.

From there, things went surprisingly well. Over 13 appearances and 16.0 innings in the season's final two months, Garcia put up solid strikeout and walk rates of 20.3 and 8.7 percent, respectively. Along with an uptick in grounders, to a respectable 49.0 percent, this granted him a 2.81 ERA and 2.51 FIP. Garcia came back from his injury a completely different pitcher, to a degree that renews hope for his future.

This progress was no fluke: Across the board, Garcia's peripheral statistics got better in the second half. He threw more strikes (62.3 percent, up from 55.8 percent), while accumulating more called strikes (19.0 percent, up from 17.8 percent) and swinging strikes (9.3 percent, up from 8.7 percent) as well. Interestingly, his zone rate actually declined, from 48.8 percent to 44.9 percent. However, because hitters chased 29.4 percent of the time in his second stint — compared to just 17.6 percent of the time in his first — he managed to net those gains in strikes.

Of Garcia's three primary pitches — a sinker, a four-seam fastball, and a slider — the latter two stood apart after his return. Both offerings saw their strike rates jump, and each made gains in one of the two strikeout pitches:

Half  FF Strike%   FF Look%   SL Strike%   SL Whiff% 
First 51.5% 15.2% 62.9% 14.5%
 Second  63.8% 18.8% 69.1% 20.6%

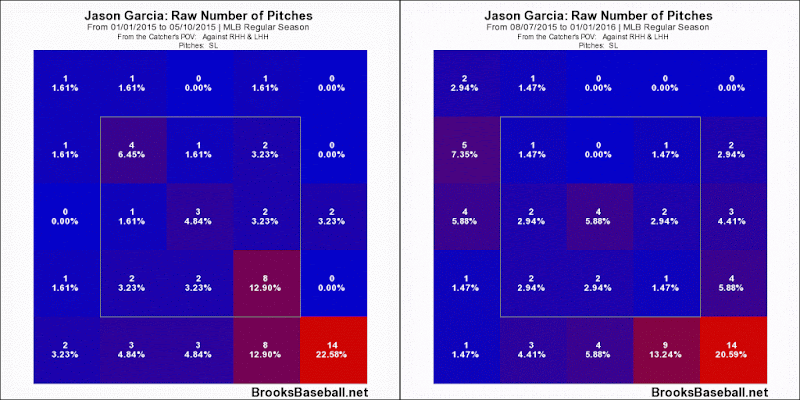
Since a decline in walk rate helped Garcia's case the most, it would seem likely that he improved his command. Indeed, that looks like the case for his four-seamer...


...and for his slider:


Garcia consistently placed both pitches differently in his later appearances. The four-seamer went to the lower part of the strike zone, and the slider began to avoid the zone entirely. Heaters typically work the best when they attack batters, whereas off-speed offerings will generally succeed from deception, so this strategy — stay in the zone with the four-seamer and goad opponents with the slider — makes sense. Garcia has always struggled with command, meaning he may have trouble sticking to this approach. With that said, the fact that he accomplished it here means he could do it again.

Command didn't act alone, though — Garcia also bettered the movement on his pitches, especially the slider:


Note how the slider starts to separate from the harder pitches toward the end of the season. When everything a pitcher throws moves similarly, hitters will become accustomed to it and tee off. Even though Garcia's velocity didn't change much from the first half to the second, the more distinct movement helped keep the opposition on their toes.

Clearly, Garcia has room for further growth. These two pitches fared well in 2015, but the third, his sinker, floundered endlessly. During August and September, it saw fewer strikes, fewer looks, and fewer whiffs than it had in April and May. This probably explains why Garcia was merely average, rather than exceptional, during the former period: He only had two competent arrows in his quiver.

There's also the matter of Garcia's platoon split. In both halves of 2015, he performed horribly against left-handed batters, who posted an overall 24.5 percent walk rate and 10.2 percent strikeout rate against him (somehow, those are not typos). Unless he improves upon that, he'll never become anything more than a ROOGY; to get better, he'll have to refine his changeup, which he implemented sparingly last season and which hasn't shown much potential to date.

Garcia clearly has a limited ceiling — if he didn't, Boston wouldn't have let him leave. Still, the pieces are here for a solid relief arm. Unless injuries ravage the Baltimore bullpen, Garcia will spend most of 2016 in the minors, where he'll hone his pitches, make sure the command sticks around, and get some work in against southpaws. At this point, the book on Flaherty and McFarland has probably closed, Garcia's tale has just begun.

20 January 2016

Taking Another Cut At The Chris Davis Contract

by Jake Brintzenhofe

Over the past several weeks, the writers at Camden Depot have taken multiple looks at Chris Davis and his contract. During this process, we became aware of Jake Brintzenhofe taking on the same question, but from a slightly different perspective. He currently is part of the expanded roster (feel free to email us with a sample article if you are interested in being a part of that) and may be joining the stables. Click here for the Chris Davis archives.

For two out of the last three years, Chris Davis played outstanding baseball. Per Baseball Reference, Davis tallied WARs of 6.5, 1.8, and 5.2 WAR in this three-year period – two all-star caliber seasons and one borderline everyday player caliber season. This winter, Davis hit the free agent market with the expectation of cashing in long term on those two years of success. This post examines what a team could reasonably expect to get out of Davis over the next seven years and what that means regarding the seven-year, $161 million contract that the Orioles gave him.

The Process
It is within the realm of possibility that Chris Davis could produce a simply Bondsian late career stretch where he harnesses power and plate discipline to become a dangerous hitter through his 30s. It is also within the realm of possibility for him to do what most players do and decline rather rapidly beginning in his early 30s. To determine where Davis's future lies, we have a process.

The approach is a comparison model based on the performance of similar players in the past in their age 30-36 seasons. Baseball Reference’s similarity score feature lists the 10 most similar players in baseball history through their age 29 seasons – a similar, but ultimately different method than what Jon Shepherd used. Using those similar players, we’ll calculate their total WAR over their age 30-36 season, attach a linear weight to it based on the degree of similarity to Davis, and calculate our projection from there.

Weights were calculated by dividing each individual similarity score by the average similarity score of the group and then dividing that number by 10 – the number of players we’re comparing to Davis. Dividing by 10 makes it so that when we add up our equation, we get our total projection with each player contributing a little more or a little less than 10% to the total. For example, Richie Sexson’s weight was his 944 similarity score over the 924.6 average and then we divided that number by 10. We then multiplied that number by Sexson’s age 30-36 total WAR.

The top 10 most similar players to Chris Davis through their age 29 seasons were, in order: Richie Sexson, Cecil Fielder, Mark McGwire, Glenn Davis, Lee May, Dave Kingman, Tino Martinez, Tony Clark, Nick Swisher, and Willie Stargell. This motley mix of steroid era mashers, overweight first basemen, journeymen, and borderline Hall of Famers feels about right for Davis’s career arc to me. He has had two seasons at the plate that jump directly off the page in the midst of an otherwise forgettable career characterized by strikeouts, forgettable defense, and splashes of raw power.

Let’s get to the math.

The Model
Based on the similarity score weighting detailed above, we get the following equation:
Projected WAR = .1020982(SexsonWAR)+.1016656(FielderWAR)+.1011248(McGwireWAR)+.1006922(DavisWAR)+.1000433(MayWAR)+.0992862(KingmanWAR)+.0989617(MartinezWAR)+.0989617(ClarkWAR)+.0986372(SwisherWAR)+.0985291(StargellWAR)
Subbing in each player’s WAR from his age 30-36 seasons we get our calculation of Projected WAR = 10.618

Financial Analysis
On the open market each WAR that a player accrues is worth $7 million. That leaves us with the quick little calculation below:
10.618 Projected WAR * $7 million per win = $74.326 million
He almost got halfway to $161 million in projected value. Almost. What this calculation says is that our projection puts Davis as being worth $74.326 million in baseball productivity over the next seven years of his career.

A reasonable point to raise would be that this calculation doesn’t examine the revenue aspect of the game – that’s completely true; it doesn’t. To mend this, I ran a quick regression of team wins on revenue while correcting for year and got the following output. Team wins were taken from 2001-2014 from eight teams to match with available revenue data.


If you’re not familiar with regression output, this chart says two main things that we really need to look at. First, for every additional win a team accrues, it can expect $2.75 million in additional revenue when holding the year constant. Second, this calculation is statistically significant at the 95% level. This means that we’re almost completely sure the additional revenue per win is between $1.74 million and $3.77 million and that our best estimate is $2.75 million.

Adding in our new revenue data and extrapolating a bit onto the next seven years, we get that Davis will be worth an additional $29.2 million.
$2.75 million per win*10.618 Projected WAR = $29.2 million in expected revenue
Adding the $29.2 million to the $74.326 million in market value, we get that Davis is projected to be worth a total of $103.526 million over the next seven years.

We’re not quite done though. Because the Orioles will not be paying him upfront, but instead on a year-by-year basis, we need to do a present value calculation on his value that way. The idea is that paying someone $10 million today looks a lot different than paying them $10 million in 1916 or in 2116. To do this, we’ll assume an annual inflation rate of 3% - the long-term historical average. The calculation will break down Davis’s expected annual value and modify it with the expected inflation.
7 year value=14.79+1.03(14.79)+〖1.03〗^2 (14.79)+〖1.03〗^3 (14.79)+〖1.03〗^4 (14.79)+〖1.03〗^5 (14.79)+〖1.03〗^6 (14.79)
Seven-year value = $113.328 million
The reason for the additional size of the exponent in each term is that inflation happens every year. Next year will inflate 3% over this year and the following year will inflate 3% over next year – we need to assess this every year.

So our conclusion is that in baseball performance and revenue dollars added, we can project Chris Davis to be worth $113.328 million over the next seven years.

Recommendation
10.618 wins over seven years does not measure up to the contract. Even with increased revenue from the wins, the Orioles could perhaps find those 10 wins in a cheaper way with a few smaller contracts on a roster that still has a couple gaping holes. 

If I were a GM, I would have stayed far away from Davis. You could probably have talked me into a somewhat inflated contract of seven years for about $120 million where we gamble with the idea that maybe those two great years are the real Chris Davis going forward. I could live with throwing away several million dollars in expected value in that bet with the hopes of hitting it big.

That said, seven years for $161 million is asking the GM to gamble $50 million of his owner’s money on the possibility that an old and slow first baseman will somehow manage a few more years of peak performance and then age gracefully. This is pretty much like a kid blowing $200 of his parents’ money at a carnival and coming away with a slew of teddy bears that they could have snagged at the local Wal-Mart for $100. 

Closing
The Orioles gave Davis a huge deal and that was always the likeliest outcome. Robinson Cano got paid, Prince Fielder got paid, Anaheim will be direct depositing checks into Albert Pujols’s account for the next five years – these things happen. If you’re an Orioles fan, just hope that the real Davis is the power hitting monster that we’ve gotten to watch for two years and that Orioles fans aren’t explaining the importance of frugality to their kids with this contract as an example in three years.

19 January 2016

How Well Are The Contract Projections Holding Up: Position Players

At the beginning of the off season, several different writers/entities decided to give a go at what they thought the market would bring.  At Camden Depot, I developed BORAS.  It is a model that looks at recent multi-year performance and individual characteristics, regressing that to contracts signed in years past.  Fangraphs reported two different prediction approaches: the thoughts of writer Dave Cameron as well as performing crowd surveys.  MLB Trade Rumors releases predictions from founder Tim Dierkes each year.  Former GM Jim Bowden and writer Jon Heyman also produce their own lists.

The season is not done, but we do have nine total position players that all six predictions have covered.  It might be good to think about how each of us has performed in order to look forward as the final players come trickling in to agree to terms.  Now, a few notes: (1) I am only considering position players here because my BORAS model is an entirely different model for pitchers as opposed to position players and I am unaware that anyone else has that issue; (2) None of our systems consider deferred money, so that is the elephant in the room that I will remain pretending that it does not exist; and (3) this comparison is based on yearly salary as defined by total divided by years.  In reality AAV is very much impacted by years, but I think with how the different estimates come about that years are an aspect that is not exactly as well drilled down than AAV.  I would also comment that contract years is a prediction that all systems get right roughly the same with differences of at most a year.

The table below shows the current performance of each model and reports on the difference between the predicted and actual spending, the regression coefficient from Least Squares Fitting, and standard deviations related to that coefficient.

Difference LSF 1SD 2SD
BORAS 1.30% 1.01 0.04 0.08
Bowden 0.20% 1.01 0.03 0.07
Cameron 8.20% 0.90 0.05 0.10
Dierkes 5.80% 0.94 0.04 0.10
FGC 3% 1.03 0.03 0.06
Heyman 7.80% 0.93 0.04 0.09

Jim Bowden's estimates has been solid as shown by his estimates missing on total by only 0.2% spending and the Least Squares Fit (you want that to be 1 as it is the slope of the relationship between the estimate and the actual AAV).  His estimates have also been very internally consistent as shown by the standard deviations.  The BORAS model comes in behind Bowden with overall accuracy, but is more middle of the pack with internal consistency.  The others have dealt with overestimating the market and being a little bit more dispersed.

A major issue for Cameron, Dierkes, and Heyman may be that they overestimated the price per win.  For Cameron, I believe he begins with the assumption that the cost is 8 MM per win with that cost increasing 5% each season.  My own calculations assumed 7 MM per win and a 5% increase with each year.  If that was the only issue, then we should see a 14% difference between our estimates and that is not the case.  I do think though that the cost per win is likely part of the reason for the difference.  For individuals like Heyman who likely do not cost cost per win, it would be more akin with him thinking in general that more money was out there for the taking.

Anyway, the offseason chugs along and below are a smattering of available free agent position players and how the three currently best performing systems view them.

Years BORAS Bowden FGC
Howie Kendrick 2 to 4 13.4 15 13
Yoenis Cespedes 5 to 7 18.8 21 22
Justin Upton 4 to 7 16.5 23 20
Dexter Fowler 2 to 4 12.1 15 14
Austin Jackson 2 to 4 12.4 10 10

The apple amongst these oranges is Justin Upton.  BORAS thinks Upton is good, but is not really impressed with him.  The model largely sees him as being pretty good, but not valuing that he has been pretty good incredibly consistently.  BORAS seems to appreciate exceptional years more than being an extremely good lunch pail slinger.  Upton could very well be a big enough miss for BORAS to knock the model down a peg.  To a lesser extent that might be true of any eventual Cespedes deal.

What the above table does make me think is that perhaps if the Orioles choose to grab another starting position player that perhaps Austin Jackson might be a good one to grab.  Him and Fowler are similarly valuable players, but Jackson has a stigma lying over him of which I am unsure why.  He wound up being a glorified bench player with the Cubs at the end of last season, which is a considerable red flag or, perhaps, a considerable opportunity to find a starting quality outfielder on the cheap.


***6:52 am***
As expected, the Upton deal changes the landscape here a bit.  With him pulling in almost exactly what Bowden suggested and well beyond what BORAS pegged, we can expect to see quite a shift in model accuracy.  For the sake of my model, it will likely need to perform well on the remaining deals to get back close to Bowden's predictions.

18 January 2016

What Should You Think Of The Chris Davis Deal?

Chris Davis is going to re-sign with the Orioles, and he'll be playing in Baltimore for the foreseeable future. In a few ways, that's a very good thing. He's talented at what he does. He's one of the premier power hitters in the game. He's popular among fans. And he's well liked by teammates, who clearly want him back.

If you want to just stop there, that's fine. This doesn't have to be complicated. Watching sports is supposed to be fun, and the Orioles (on offense, at least) should be enjoyable to watch for the next few years (and maybe longer). But we do our best to dig a little deeper here, and you probably wouldn't be reading this if we didn't.

I've been trying to figure out what's bothering me most about the Orioles' decision to re-sign Davis. It's not the enormous amount of money, which seemed comical at first but is at least less bad after the reported amount of deferred money. Jon discussed Davis's contract in detail on Saturday, and you should give it a read.

It's not that Davis turns 30 soon and plays first base, and it's extremely risky to hand out such a lucrative contract to those types of players. That's not stating anything new.

It's not that the Orioles have spent a lot of money and, for now at least, seem very similar to last year's team.

It's not even that the Orioles seemed to bid against themselves to get the deal done, with no clear competitor in the market for Davis's services. It's tough to see that $161 million figure and wonder which other team was willing to come close to that offer.

All of those things matter. But I have more of an issue with Peter Angelos willing to spend a huge sum of money for one player -- only to reel in Davis. If Davis were far and away the best player on the market, maybe that would be easier to defend. But he wasn't. There was nothing hidden about the priority to keep Davis at seemingly whatever cost; Dan Connolly, formerly of The Baltimore Sunwas on top of this a month ago. Angelos inserted himself in the negotiations with Scott Boras early on, demonstrating the level of seriousness in keeping Davis in an O's uniform.

Jeff Sullivan of FanGraphs expanded on this topic in his analysis of the Davis deal. Here's a section of his excellent post:
The idea presented: the money budgeted for Chris Davis wasn’t being budgeted for just anyone. Angelos has a particular fondness for Davis, and a particular appreciation of everything he’s done. It’s not quite that Davis is being paid right out of Angelos’ pocket, from a completely separate budget, but there are hints that the Orioles’ payroll might go higher with Davis than it would’ve without Davis. If that’s in any way true, then it has to also be a factor, because it means the Orioles would spend more on a team with Davis than they would on a team with, say, Yoenis Cespedes. Again, if that’s true, it would mean Davis is getting money that wouldn’t have been put elsewhere.
Sullivan later hits on a point that gets to exactly what has been eating at me: "...as a fan it could be frustrating to think about this situation because you’d want the same amount of money to be available regardless." And that option evidently was not available here, regardless of whatever offer the Orioles had extended to Yoenis Cespedes. You couldn't pick between Justin Upton, Cespedes, and Davis, because Upton and Cespedes were never real options for similar money (barring a tremendous discount or a bizarre short-term deal). It's better to have Davis than none of the three.

If the Orioles didn't have a particular amount of money set aside, and whatever else Angelos was willing to give to Davis was just icing on the cake, then maybe this is all easier to swallow. It seems likely that Connolly was right all along that the Orioles (Angelos, really) did not want to go above $100 million for any other player. But it's unsettling both because we'll never know for sure, and that also maybe isn't the best way to go about things.

Overpaying for sentimental reasons and past performance isn't a great pattern to follow, though willing to go above and beyond for a skilled player is a positive (especially if that extra money would not have been available for anyone else). The best use of all funds would be to use them in a way to build the best possible team, but that option likely was not on the table.

Do you really care about Angelos losing money on the Davis deal if it starts to go south in a hurry? Would you rather him just pocket that extra money? Probably not. But if this contract affects the likelihood of Manny Machado signing an extension, it will look much worse. This is the type of contract that can hamstring a team. That concern is real.

Then again, maybe Machado will be one of Angelos's guys, and he'll be willing to go above and beyond for him, too. At least in that case, he'll be making an exception for one of the very best players in the game. But let's not get ahead of ourselves or anything. Let's instead start with hoping that the 2014 version of Davis doesn't resurface anytime soon.

16 January 2016

Orioles Go Slightly Bananas And Sign Chris Davis

Did Someone Say Bananas!
Signing Chris Davis was not a surprise.  I stated that he would be with the club in 2016 back in September when Peter Angelos specifically identified Davis as the only departing player he wanted back in the fold.  Although I advocated for the club to look elsewhere, I have maintained my prediction that Davis would return and that it would not be a good thing.  On the former, I have been redeemed with the Orioles signing him to a seven year deal worth 161 MM with 42 MM of that deferred, a deal in which we should assume that they outbid someone.  A partial no trade clause is in effect until he assumes 10-5 rights in 2019.  Of course, any no trade clause is somewhat redundant because this contract is rather unwieldy.  It would not be entirely surprising though to see him later involved like Prince Fielder was where the Orioles throw in a great deal of money and get an unwanted but slightly useful player in return.  On the latter, it does not look like a good thing, but we won't know for sure until months or years from now.  That said, I still think it is a poor move.

Cost and value can be looked at in a couple ways.  Two of the approaches I have taken to determine value of a player are: (1) projections of market value based on retrospective performance and (2) projections of cost per win based on comparison modelling of future performance.  I christened a model BORAS which looks at past market value based on age and offensive performance.  That model thought the contract Davis would seek would be four to six years in length with a 20.8 MM annual salary.  Off the bat, seven years is considered a sizable deviation.  A 23 MM AAV is not beyond the 95% Confidence Limits, but certainly would be considered in the top quartile.  In other words, it is a uniquely high salary for a uniquely high length of contract, according to this model.  Perhaps a simpler way to put it is that the contract is one year too long and 35 MM too expensive.

The comparison model does not have a snazzy name because it simply is what so many people already do around the league and on the internets.  You can read about it here.  That model does not set any idea about how long a deal should be, but what value we can expect coming out of that deal.  For seven years, the upper composite value is 172 MM with the 50th percentile mark as 104 MM.  That is a pretty wide divide and the top tier is largely driven by amazing performance by Sammy Sosa, Jay Buhner, and Frank Howard, players who blossomed later than normal and had strong seasons in their thirties.  If you considered all the similar players, then the conclusion would be that the Orioles overpaid here by 57 MM.

The deferred payments changes the contract slightly.  As it stands the deal will take 22 years to complete with payments.  He gets 17 MM from 2016-2022, 3.5 MM from 2023-2032, and 1.4 MM from 2033-2037.  In today's money the deal could be expressed as roughly seven years and 138 MM or that Davis needs to deliver roughly 18 WAR.  The 50th percentile projection puts him at 12.5 WAR while the upper level projection is at 21.8 WAR.  With that in mind, BORAS would now say that is 1/13 too much and the comp model would be marked down to 34 MM overpay.  Regardless, the deal looks optimistic, but not egregiously so.

Where the deal looks worse has to do with fit and the consequence of holding onto Chris Davis.  First of all, Davis brings to the immediate a strong bat with a heavy right handed favored split.  This might bring visions of Ryan Howard in your head, but keep in mind that Howard was useful until his Achilles gave out the year before his extension went into effect.  Most ways to look at it though point towards Davis likely being a useful to very useful presence for the next three to four years and then be rather poor.  The reason for that has to do with how does what he does so well, which is to only touch a few balls but make those touches count.  Players with big power and poor contact rate tend to develop a couple years later than normal and stick around for an extra year or two before seeing their value completely collapse.  Players similar to Davis in the past often experienced complete loss of ability likely due to them depending so much on a fringe skill (i.e., contact) to take advantage of their another very loud tool (i.e., power).

Wile Davis should indeed be helpful in the near term and provide a needed left handed bat, he really is not what I would call the best fit for the club.  Depending on what else the Orioles do (there is talk about the club remaining in the Yoenis Cespedes market due to pitching drying up), they may be pressured to play Davis in right field.  Metrics project a range for Davis of -15 to 0 defensive runs.  If you ask scouts and front office folks, they lean hard toward the -15 mark.  If you ask Scott Boras or my 13 year old nephew, they lean hard to 0 and also suggest that Davis should be a swing man to buoy the rotation.  What this all means to me is that the club was in more need of a strong presence in right field defensively than a left handed bat.  Cespedes might well be worth two to even three wins more than Davis defensively in right field, which may mean more to a club whose starting pitching does not exactly miss bats.

On top of this, we would have expected Chris Davis to have signed somewhere even though no other suitors ever made it known they were interested in him (although the Houston Astros made a great deal of sense).  If Davis would have signed elsewhere, the Orioles would have been awarded something near the 32nd pick in the 2016 draft, which is worth about 7 MM.  That turns the deal into something more like seven years and 145 MM.

When it is all said and done, the deal looks poor, but not monumentally foolish.  I think they spent too much for a player who was slightly more of a luxury than them actually addressing a more pressing need.  Davis will likely provide good value for the next three to four years, but it would not be surprising if he is released before the end of this contract.  The comparison modelling says it is a 50/50 shot that he is a MLB player the final year of the deal.