06 July 2016

Ubaldo Jimenez Wasn't Always Terrible

Your first memories of something are always the most vivid ones. The ones that stick the longest, that you judge the coming ones against. I started getting deeper into baseball in 2010, the year that Ubaldo Jimenez finished third in NL Cy Young voting. With a wicked fastball that averaged 96 and touched 100 MPH at times, a devastating slider and a change that kept hitters honest, Jimenez was the last true ace I can remember getting it done at Coors. By using park and time adjusted statistics, Jimenez' 63 ERA- in 2010 equals what Noah Syndergaard is doing this year, and he kept it up for 221 innings. In Coors!

So that's why sometimes I look at Ubaldo Jimenez' player page on Baseball Reference sometimes. It feels almost like visiting an old friend's grave. Yesterday I was paying my respects, and came across this fun fact. After serving up a grand slam to the Mariners' Seth Smith on Sunday, July 3, Jimenez now has the same home run total in 80 IP this season as he did in 221 IP in 2010. That total is ten.

The back half of the O's rotation is an on-fire garbage can, and Ubaldo likely won't recapture anything close to his 2010 peak down the stretch. Nobody should expect him to. He currently leads all of baseball in earned runs after a few implosions, and he leads the AL in walks. His 4 year/$50M contract is up after next season, and at age 33 with rapidly declining velocity the market for his arm will be thin.

Basically, things are looking down for Ol' Ubaldo, so I thought I would take some time to look back on his dominance with some numbers and GIFs. The first thing that made me fall in love with him is his unique delivery in which he literally looks like he's reaching back for more. The backwards rock and arm extension have always been there, and he experimented with an over the head movement before his delivery in 2015 that was funky.


He might be worth negative 1.3 WAR as of this writing, and he might flame out of the league in a few years, but Ubaldo Jimenez was pretty awesome and it's worth looking back at some of the highlights from his stellar 2010 campaign. 

1. The No-Hitter

The crown jewel of any legendary pitching season is a no-hitter. Jimenez didn't win the Cy Young, but the no-no sure helped smooth over some of his bumps (he ran a 3.7 BB/9 in 2010; some things never change) and make him compare more favorably against prime Roy Halladay and Adam Wainwright.

Jimenez needed 128 pitches (throwing just 72 for strikes and walking six batters) to throw the first no-hitter in Rockies history against a Braves offense that was a hell of a lot better than this year's scrubs. He had trouble locating his offspeed and breaking stuff (which led to the six walks) but his fastball was the money pitch, touching 100 MPH several times. Here are some nasty examples.

Exhibit A
97 MPH painted on the inside corner. 

Exhibit B
 A young, pre-faceguard Jason Heyward. So innocent.

Exhibit C
And a particularly devastating splitter to Eric Hinske for good measure.


Other great moments from the no-hitter: Jimenez helped out his own cause with an RBI single, and Dexter Fowler made an incredible diving catch in center to keep it intact. There's something about Dexter Fowler and no-nos.

2. The Scorching Start

If you like wins, Jimenez won 15 of his first 16 starts in 2010. Since the five-man rotation became the norm, only Pedro Martinez, Greg Maddux, Steve Carlton, and Joaquin Andujar have accomplished that feat. The gaudy win totals were somewhat aided by the Rockies' potent offense, but he was a straight up workhorse, reeling off 14 consecutive quality starts out of the gates.

Looking at his first 11 starts through April and May, he was completely unhittable.


According to WPA (Win Probability Added), Jimenez alone accounted for over three wins for the Rockies in just 80.1 IP. The stretch included the no-hitter, two complete game shutouts, a 13 strikeout gem, and eight outings with Game Scores of 70 or higher. Perhaps the most impressive part of this stretch is that he managed to keep his ERA under 1.00 for 80 IP while posting a very average 2.7 K:BB ratio.

Jimenez dropped off considerably after the first two months, posting a 4.41 ERA in June and a 6.04 ERA in July. But as Jake Arrieta showed last year, Cy Young voters love otherworldly hot streaks. Especially when they happen at Coors

3. The First and Only Coors Workhorse

The no-hitter pitch count ran up to 128 pitches, and Jimenez followed it up five days later with a scoreless 121-pitch outing. Maybe Manager Jim Tracy was possessed by the spirit of Dusty Baker, or maybe this was normal in 2010, but Jimenez threw 120+ pitches in nine starts that season. He made three of those 120+ pitch starts in a 17 day period in August. All you need to see to understand the kind of toll that takes on an arm is this velocity chart.

For some reason the time axis is messed up, but the sudden drop off in velocity lines up perfectly with the beginning of his 2011 season. We can probably thank Jim Tracy for the 90-92 MPH garbage heaters that we're used to now. 

Jimenez was not impervious to fatigue or the thin Rocky Mountain air. His home ERA was 0.56 higher than on the road, his OPS allowed was a full .100 higher at home, his K/9 was 0.5 lower at home. He was human, and humans get shelled at Coors occasionally, but he was also the first and only workhorse to ever pitch for Colorado.

Here is a complete list of Rockies pitchers who have surpassed 200 IP in a season, sorted by their ERAs. Notice how by ERA+ many of those seemingly pedestrian seasons were actually well above league average when you factor in the Coors effect.


And this is a complete list of Rockies pitchers who have posted sub-3.00 ERAs and qualified for the ERA title.
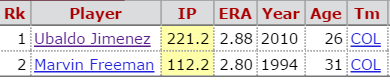

The Colorado Rockies have only existed for 25 years, but it's safe to say that Ubaldo Jimenez owns the most (only?) dominant season in the team's history. That doesn't change the fact that the O's are paying him $13 million for what's shaping up to be a -2 WAR season, but it makes it a little easier to swallow knowing that Jimenez is kinda, sort of a legend.

05 July 2016

Oliver!


Joe Reisel's Archives


Oliver Drake, consider yourself a major-league caliber pitcher. Photo courtesy of Steven Goldburg/Norfolk Tides.
On June 21, the Orioles recalled relief pitcher Oliver Drake from their AAA affiliate, the Norfolk Tides. I believed that promotion was long overdue, even granting that the Orioles have had several right-handed relief pitchers, because Drake had pitched very effectively. For example, I didn't understand why the Orioles promoted the relatively inexperienced Mychal Givens when Drake was pitching more effectively at a higher level and had a longer track record than Givens.

There's no denying that Oliver Drake has pitched very well for Norfolk. Last season, Drake had a 0.82 ERA - and allowed zero unearned runs - while striking out 66 batters in 44 innings. He did walk 16 in those 44 innings, but he balanced that by only allowing 23 hits and 1 home run. This season, he had a period during which he struggled, but he still has a 2.02 ERA with 42 strikeouts in 26 2/3 innings. He has allowed more baserunners - 13 walks and 18 hits in those 26 2/3 innings - but over is last 12 innings, he allowed no runs on 5 hits and 2 walks, with 23 strikeouts.

I believe that almost any pitcher who can be as effective as Oliver Drake has been in AAA can and probably should be an effective major-league set-up man, and there's an excellent chance he could be an effective closer at least for a short time. After all, Jim Henderson closed for a season. When you compare Henderson to Drake, it's ludicrous to think that Oliver Drake can't be a closer.

I do understand the reasoning why Drake hasn't been given a real opportunity. He relies heavily on a trick pitch, his forkball / splitter. And he has a deceptive delivery in which he hides the ball from the batter for a long period. There is a legitimate fear that such trickery won't work against big-league hitters and that batters are swinging at pitches out of the strike zone. The thinking is that major-league hitters will not be fooled and will lay off the non-strikes, forcing Drake to throw his rather ordinary fastball for strikes. The batters will respond by hitting him hard and Drake will be ineffective.

While I have no real way of telling whether major-league hitters will be fooled by his deception, I can look at his performance to see if batters are swinging at pitches out of the zone. Over the past two years, I've scored 77 Norfolk games, 50 in 2015 and 27 so far in 2016. We can look at Drake's pitching and determine if Drake is getting a low percentage of called strikes. The theory behind this is that if Drake isn't getting a low percentage of called strikes, then batters aren't exclusively swinging and missing at pitches out of the strike zone and that Drake can be effective even when he's throwing pitches in the strike zone.

The below table shows the results of the pitches I've Drake throw over the past two seasons:


Called Ball
Called Strike
Swinging Strike
 
Foul
 
In-Play
2015
75
29
50
39
25
2016
77
45
36
36
24

That I've seen Drake throw the same number of pitches in the 27 games I've scored in 2016 as in the 50 games I scored in 2015 is simply luck of the draw; for a variety of reasons I've seen more of the games in which Drake pitched this year than last. That the number of pitches is exactly the same is sheer coincidence.

The data shows that when Drake was extraordinarily effective in 2015, Drake got more strikes on swings in 2015 than he has in 2016. But I don't think the data necessarily implies that batters swung at pitches out of the strike zone in 2015 and stopped doing so in 2016. If that were the case, then Drake would have substantially more called balls in 2016 than in 2015. He doesn't. To me, it's more likely that batters were swinging and missing at borderline pitches in 2015 and taking them in 2016. That would imply that Drake doesn't rely on batters swinging at "bad" pitches and that he doesn't necessarily have to throw more hittable pitches.

Oliver Drake has been extremely effective in AAA over the past season-and-a-half. He's earned a real shot at a major-league job. The Orioles have a very good and very deep bullpen, so Drake may be limited to mop-up roles. He's not the "ideal" relief pitcher candidate because he doesn't have a high-90's fastball, but he has earned a real shot at a big-league job. I believe that Drake should be an effective seventh- or eighth-inning reliever and wouldn't have a problem giving him a chance at being a closer.

(Since this article was originally written, Drake was optioned back to Norfolk after two ineffective outings. Two ineffective outings, of course, mean very little and I stand by the opinions expressed in this article.)

01 July 2016

Jonathan Schoop Is Crushing Ground Balls

The Orioles crush the ball when they make contact. Through 76 games, according to data via ESPN Stats and Information, they average a .361/.358/.628 line and a .427 wOBA when they put the ball into play, easily the best in the majors. Out of 169 qualified batters, while the Rockies have the top two players on the list (Story and CarGo), Chris Davis ranks third, Mark Trumbo ranks seventh and Manny ranks eighth. It’s fair to say that these three hitters are the heart of the Orioles’ offense. Then, while Wieters, Kim, Jones and Alvarez are all having strong years, it is arguable that Schoop has been the fourth best offensive piece.

Schoop is no exception to this rule. Respectably for a second baseman, Schoop ranks 35th in production on balls put into play. However, he is taking a surprising route to success. Chris Davis ranks 1st, Mark Trumbo ranks 8th and Manny Machado ranks 18th when putting pitches in the strike zone into play. Schoop has a .435 wOBA when putting pitches in the strike zone into play, good for only 73rd. Schoop has a .506 wOBA, good for second in the majors, when putting pitches out of the strike zone into play. In contrast, Manny Machado ranks 9th, Trumbo ranks 25th, and Davis ranks 142nd.

Schoop’s success against pitches out of the strike zone put into play is sparked in large part due to a high BABIP. He has a .315 BABIP when putting pitches in the strike zone into play, while having an absurd .442 BABIP against pitches out of the strike zone. Despite the fact that Schoop has more production hitting pitches out of the strike zone than in the strike zone, he has a 6.3% chance of hitting a home run when hitting a pitch in the strike zone compared to a 4.4% chance of hitting a home run when the pitch is out of the strike zone. Likewise, he has an 8.5% chance of hitting a double when hitting a pitch in the strike zone and an 5.2% chance when the pitch is out of the strike zone. It seems that he has had extreme success hitting singles, but only singles, against pitches out of the strike zone as he has a 33.3% chance of hitting a single on a pitch out of the strike zone compared to a 21% chance when the pitch is in the strike zone.

He isn’t getting better contact against pitches out of the strike zone. He hits 22% Line Drives, 36% Fly Balls and 41% Grounders when hitting pitches in the strike zone and 13% Line Drives, 20% Fly Balls and 62% Grounders when hitting pitches out of the strike zone. He’s just having a lot of success hitting ground balls when putting pitches out of the strike zone into play. He has a .289 wOBA when hitting a grounder on a pitch in the strike zone and a .396 wOBA (.429/.429/.464) when hitting a grounder on a pitch out of the strike zone. He’s only 22 for 72 with 3 doubles (4.2% double rate) on pitches in the strike zone that are grounders, but is 12 for 28 with 1 double (3.5% double rate) on pitches out of the strike zone that are grounders. According to this data set, he’s only hit 15 fly balls and line drives combined on pitches thrown out of the strike zone, and therefore it’s too small of a sample to derive anything meaningful.

Schoop’s .396 wOBA against grounders hit on pitches thrown out of the strike zone is second in the majors and is more than double the major league average of .185. Not only this, but a .396 wOBA would rank second in production for all ground balls hit regardless of if they're in the strike zone or not. It would only trail Ozuna’s .407 mark while being 166 points above the major league average of .230. Unsurprisingly, this has led him to being fifth in wOBA on ground balls in MLB this year. However, his .289 wOBA against grounders hit on pitches in the strike zone ranks 36th and is only 40 points above the major league average of .247.  It’s fascinating how he’s doing excellently hitting ground balls when a pitch is out of the strike zone, but is merely above average when hitting grounders when a pitch is in the strike zone.

Schoop needs to be successful when putting the ball into play because, as fellow author Elie wrote, he doesn’t walk. Schoop swings at over 60% of all pitches, which is the most of any batter in the majors. As a result, he only has a 30% called ball rate. It’s hard to walk when he doesn’t let pitchers throw him balls and therefore he only has a 3.7% walk rate and just a .119 wOBA (162nd out of 169) in plate appearances that result in a pitch being put into play. His offense comes from his ability to hammer the ball.

Furthermore, he needs to continue hammering pitches outside of the strike zone. If his ability to do that drops to just average, then his wOBA on pitches put into play will drop from .449 to .408 and his rank will drop from 35th to 69th. That means his overall wOBA will drop from .365 to .334 and his overall offensive rank will drop from 58th to 99th. In other words, his offensive performance will go from the 66th percentile to the 40th percentile so he’ll go from being above average to below average. Below average performance is acceptable from a second baseman, but it will certainly have an impact on the offense.

Then again, Schoop had significant success last season when putting pitches out of the strike zone into play. Indeed, last year he had a .358 wOBA when putting pitches out of the strike zone into play as ground balls. Maybe he is able to turn pitches in those areas into hard grounders that are more likely to become singles.

Looking at Statcast data from 2015-2016, he’s 23 for 42 with 2 reached on error and 3 doubles when he hits a ground ball over 100 miles per hour good for a .515 wOBA. He’s 10 for 25 with a reached on error and a double when he hits a ground ball between 95 and 100 good for a .371 wOBA. He’s 2 for 11 when he hits a grounder between 90 and 95 good for a .162 wOBA. He’s 9 for 32 with no errors and 1 double when he hits a ground ball between 80 and 90 good for a .262 wOBA.   He’s 8 for 50 with a sacrifice bunt and two reached on errors when he hits a grounder below 80 miles per hour good for a .142 wOBA. It’s clear that there’s a correlation between Schoop hitting a ground ball hard and getting a hit.  The Baseball Savant and the ESPN Stats and Information strike zones and pitch classification techniques are completely different and therefore I am unable to compare them to each other.

In general, batters do well when hitting ground balls harder than 100 mph. So far in 2016, they’re 2178 for 4990 good for a .436 batting average and a .471 slugging percentage. That's in the ballpark of 2,000 singles and 178 extra base hits. A batter that can do that will put up roughly a .400 wOBA. If Schoop can continue hammering groundballs at over 100 mph, then he may be able to keep up this performance.  But then again, why is he only able to hammer groundballs when they’re not in the strike zone? Plus he’s putting up a .515 wOBA compared to the average of .400. Is that luck or skill? I tend to think luck, but it could be a skill.

Schoop’s success this year has largely been due to getting singles when hitting groundballs on pitches thrown out of the strike zone. There is a decent year-to-year correlation when it comes to hitters’ production on pitches hit inside of the strike zone or for hitters’ production when they don’t put the ball into play but only a small one for pitches hit outside of the strike zone. This suggests that in general, hitters’ production on pitches outside of the strike zone is largely based on luck.

I tend to think that Schoop has been lucky this season and his offensive performance will soon regress to the mean. But he does have significant power and the tools to be an elite hitter. What happens if he can turn more of those 100 mph groundballs into 100 mph fastballs and line drives as he gets older? He might just have enough power to overcome his poor plate discipline.

30 June 2016

Hyun Soo Kim Has Been A Revelation

Depending on what you believe, Hyun Soo Kim's first year with the Orioles was close to not happening. Before he ever played an inning of regular season baseball, the Orioles were exploring how to get out of his contract (signed just a few months prior). As Roch Kubatko of MASN wrote in late March, "I checked again last night and the Orioles definitely are open to moving Kim, whose performance hasn’t met expectations." That would be his highly scrutinized spring training performance.

Kim did not hit well in spring training, and that, combined with other concerns (defense? baserunning? money?), put Kim's Orioles' career in jeopardy before it ever really started. The Orioles wanted Kim to start the year in Triple-A. He justifiably declined. Some fans foolishly called Kim selfish, and some even made the puzzling decision to boo him on opening day. Adam Jones rightfully admonished fans afterward.

That brings us to Kim's actual production during his debut season. Here's a summary: He just keeps hitting. Kim didn't make his debut until the O's sixth game, when he collected two singles in three trips to the plate. He appeared in the lineup sporadically through mid-May. Because he kept hitting and getting on base, he finally started seeing his name in the lineup regularly starting on May 25.

Overall, it's hard not to be impressed by the numbers. In 137 plate appearances, Kim has posted a 148 wRC+. That's second-best on the Orioles, behind Manny Machado (159 wRC+). Kim is almost certainly not this good -- a BABIP of .390 is propping up his numbers to some extent -- but he has been excellent so far and has given the Orioles way, way more than they thought they were getting in March. (Seriously, go through Kubatko's post above comparing Kim and Rickard. It's amusing.)

At the time Kim's signing was announced, fans were hoping that Kim could provide an on-base threat. He's done exactly that, with a .438 on-base percentage. That's the highest among all major league hitters with at least 100 plate appearances (David Ortiz is second at .433). Kim has walked exactly as many times as he's struck out (16), and his walk rate of 11.7% trails only Chris Davis (13.6%).

One of the amusing parts of the Orioles trying to get out of Kim's contract before the season is that not only did it seem like a reasonable deal at the time, but it only looks better now. The Orioles signed Kim for two years and $7 million, and based on his production (0.9 fWAR, 0.7 bWAR), he's essentially been worth his contract so far with a season and a half to go. Even if Kim performs at replacement level for the rest of his deal, his contract has already been worth it.

You probably couldn't have predicted it based on how the season started -- Kim buried on the bench; Adam Jones battling an injury; Joey Rickard receiving an extended stretch of at-bats as the team's everyday leadoff hitter -- but the Orioles have stumbled into an effective left field platoon with Kim and Rickard. This is how the two have performed against opposite-handed throwers:

Kim vs. RHP: 152 wRC+
Rickard vs. LHP: 129 wRC+

That is very strong production, especially considering how terrible O's left fielders were just a season ago. Perhaps Kim should be playing even more and given a chance to show what he can do against lefties, but it's hard to argue with the results.

Kim has exceeded all expectations, even before taking into account the drama during and after spring training, combined with being chained to the bench for a while. Kim hasn't reached (and likely won't reach) the point where it's expected to see him bat about 50% better than the league average. But at least 10-20% is certainly within play, and if anyone would have guaranteed you that before the season, you would have been thrilled. The same goes for the Orioles, who are surely just as surprised.

All I know is that I'd be just fine with more moments like this:

29 June 2016

Jonathan Schoop Is Breaking OBP


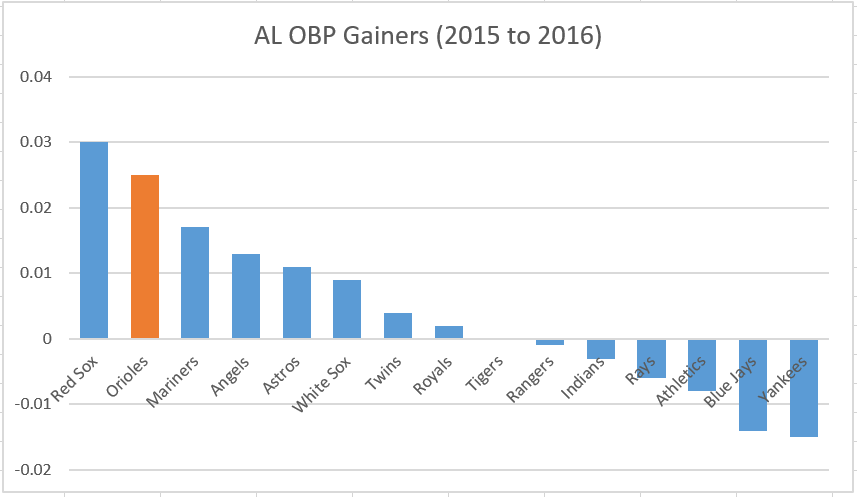
2015 is not 2016 in Baltimore. If the two seasons were made into one of those "spot the difference" games, the first thing you would notice is the homers. The O's lead all of baseball in bombs, and are close to breaking the major league record for home runs hit in a single month. But if you've been watching closely, the most glaring difference has been the men on base. The glorious men on base. The 2015 squad finished third in homers, but 24th in OBP (.307). Through almost three months, the 2016 Orioles have the second highest OBP in the AL with a .332 mark.


The Red Sox are the only AL team with a higher OBP, and the only AL team with a bigger gain in OBP from 2015 to 2016. There are many ways to get on base, and therefore many ways to raise your on-base percentage, but in general drawing more walks is the best way to go about it. And if we look at the teams that have improved in walk rate, we see a pretty strong correlation with the OBP gainers.


The Rays and the Jays are the only teams that have improved on their BB% and declined in OBP. The Royals (of course) are the only team that have posted a worse BB% but improved in OBP. So, unless you are following the Royals formula and making a ton of contact with speedy, high BABIP guys, then any increase in OBP is probably being fueled in large part thanks to a bump in your BB%. 

It's an intuitive concept to grasp, and it seems like everyone on the O's got the memo except for Jonathan Schoop. He actually has raised his BB% by a full percentage point this year. The only issue is that he raised it from 2.8% to 3.8%. For context, league average thus far is at around 8.4%. Walks have trended down over the last decade as strikeouts have risen, but any way you slice it, 3.8% is not good. 


And yet, somehow Schoop's OBP is currently sitting at .322. That isn't particularly good, but it's average, and that's all the O's need from him. To put it into perspective, Schoop's OBP beats out teammate Pedro Alvarez (.315) despite him having a BB% almost 7% lower than Alvarez. 

Schoop's inability to walk has always been troubling, but if he's found a way to get on base at a league-average rate despite his low walk rate, that eliminates arguably his biggest weakness and turns him all of a sudden into a complete player that could put up 3.0 WAR seasons at second base for years to come. 

Still, that's a big 'what if'. Without good speed, a .320 OBP is not easy to sustain with a 3.8 BB%. Looking at the underlying stats, the increase in OBP has been fed by a higher average that in turn has been supported by a .335 BABIP. While Schoop hits the ball hard enough to generate an above average BABIP, his career mark of .317 indicates a batting average regression is coming. So unless he starts getting hit by pitches regularly, the OBP should come down to around .300 by the end of the season. 

I did find two interesting adjustments that pitchers are making this season in response to Schoop's pitiful 2015 walk rate. First, Schoop is seeing 6.4% fewer fastballs according to PITCHf/x, which is a product of his .779 OPS vs. hard stuff / .635 OPS vs. soft stuff for his career. Second, Schoop has seen 6% more pitches in the strikezone (Zone%) this season compared to last, according to Baseball Info Solutions. In fact, his 48.8 Zone% is among the highest in baseball this season, which means that pitchers aren't afraid to give him a pitch to hit because they know he swings and misses a ton (his 17.5 SwStr would have led baseball last season if he had enough PA to qualify) and has poor discipline. 

But while he has continued to swing and miss a ton, he is taking the lemons and making lemonade. He's increased his contact percentage on pitches in the zone (Z-Contact%) by almost 5%, which has been a big reason behind his overall bump in Contact%. Baseball is a game of adjustments, and you can bet that pitchers will collectively dial back that Zone% as they realize that Schoop has the ability to do damage given enough pitches in the zone.   

Lastly, I thought it would be interesting to look at other players this season who have been valuable despite low walk rates. I set the WAR floor at 1.0 and the BB% ceiling at 5% and filtered to find these names.


Salvador Perez and J.T. Realmuto aren't the best comps because they get a big positional adjustment boost for being catchers. Starling Marte and Eduardo Nunez rely on their exceptional speed to get on base. Kevin Pillar fills up the WAR bucket almost entirely with his stellar center field defense. That leaves us with Adam Duvall and Rougned Odor. Both are intriguing comparisons. Odor obviously has speed but the fact that they're both second baseman who hit the ball hard brings them closer. Duvall is a more disciplined hitter but has very similar Soft/Med/Hard hit rates to Schoop. 

Regardless of which is the better comp, expect Schoop's OBP to come down to around Odor and Duvall's level (in the .290 to .300 range) as pitchers adjust and his BABIP regresses. 

27 June 2016

Orioles Rotation is Fine or The Rotation is Falling, The Rotation is Falling.

One Day a HR was hit and Oriole Little Thought the Rotation Was Failing
More money, more complaints.  That often is the way things roll.  The Orioles spent a good bit of change on Ubaldo Jimenez and the team is experiencing a typical even year performance from him (note - I cannot wait to see who is the Jimenez Whisperer in a collection of articles in October and November).  People then rejoiced that a potentially injured Yovani Gallardo signed a reduced deal and showed up with a reduced fastball.  It is enough to forget that Chris Tillman, Kevin Gausman, and Tyler *one second...checking roster* Wilson have actually performed well or well enough.

All in all, the starting rotation has neither been a problem or all that good although the common refrain from the crowd is that it has been a horrific disaster.  How does this compare to years past in terms of percentile performance in the American League?
 
ERA
FIP
xFIP
2012
40th
40th
33rd
2013
27th
7th
27th
2014
73rd
13th
13th
2015
13th
13th
40th
2016
27th
40th
40th
If you want to go by ERA, then the starting rotation has been better than last year and equal to nearly playoff bound 2013 club.  If you want to strip a little luck and defense from things, then the rotation is tied with the best one since 2012.  If you want to now strip luck, defense, and normalize home run rates,  then it also comes up as tied for the best starting rotation in the past five years.

Another way to look at performance is based on a simple view on performance.  A while back, I ran a study on what first division, average, and bottom rung pitching rotations look like based on ERA+.  Amazingly, it follows a pretty even spread:

Slot 1 2 3 4 5
AVG
1st Div 125 115 105 95 85 105
Average 115 105 95 85 75 95
Bottom 105 95 85 75 65 85
Orioles 124 112 97 72 63 94

As it stands, the Orioles have an average starting rotation, which is neither good nor a problem.  The club has a first rate bullpen and lineup, so it can work with a mediocre starting rotation.

How does the club get to a first division rotation?  It needs to replace Jimenez' 63 with a 110 ERA+.  So someone like Orioles' pitching prospect Zach Davies ().  Unfortunately, the club traded him away last year for some guy wearing a Gerardo Parra jersey (that deal was panned by me at the time and it was expressed by several scouts in the game that the Orioles gave up way too much for half an unsustainable season of Parra).  Outside of Davies, Drew Pomeranz' breakthrough or high water point season fits the bill with his ERA/FIP/xFIP slash as 2.76/3.32/3.64.  Jeremy Hellickson can also fit into that group (4.23/4.42/3.81).  You can also argue that Sonny Gray is a hopeful candidate (5.03/4.49/4.18).

Regardless, the point is that as the Orioles are four games up in the AL East with a strong record that they really have no major weakness.  Their starting pitching is not good, but we need to be realistic.  When describing the club, we should not act like Chicken Littles.  The sky simply is not falling.  That said, the club's average starting rotation does have quite a bit of room for improvement.  If starting pitching improves, the club improves from a strong playoff contender to a team barreling down the AL East freeway into the post-season. 

24 June 2016

Why The Orioles Should Trade For Nolasco

The Orioles rotation is not having a very good year. Despite the Orioles having a 41-30 record, the rotation is only 23-23 with a 4.93 ERA (4th worst in the majors). More advanced statistics treat them more favorably, as they have only the 8th lowest FIP and somehow rank 18th in fWAR. While Chris Tillman is having an excellent year, the only other starters with an ERA under 5.00 are Kevin Gausman with a 0-5 record and a 4.37 ERA and Tyler Wilson with a 3-5 record and a 4.57 ERA. An upgrade probably wouldn’t hurt for the rotation.

The challenge is that the Orioles have already spent significant resources building their rotation. They signed two free agent starters, Jimenez and Gallardo, which are earning significant cash. Likewise, Tillman is arbitration-eligible and is also making a decent sum. The Orioles may not be willing to splurge on another starting pitching asset, especially given how poorly Jimenez and Gallardo have performed. In addition, there is little quality projected to be on the market this deadline. Despite the fact that there are nine teams at least eight games below .500, there is minimal quality pitching to be found. The Orioles need to decide whether they want to deplete their few remaining sources on a gamble.

Except, there’s one pitcher, Ricky Nolasco, that will probably be available for cheap. It’s for good reason, this is his first year out of the last three where his ERA has been below 5.00, and he’s flirting with the 5.00 mark this year also. In addition, he’ll cost a pro-rated portion of $12M this year, he’s under contract for $12M in 2017 and he’s got a shot of triggering a vesting option for $13M in 2018. For this post, the data is from ESPN Stats and Information.

On first glance, he looks like a pretty awful rotation piece. However, a closer look suggests he’s a viable option for the rotation. The first hint that he may have some potential is the fact that he has a 4.95 ERA but a 3.69 FIP. The second is that he pitches for a team that plays poor defense. The Twins defense ranks 27th from 2013-2016 and has been worth -114 runs. Is bad defense causing him problems?

This year, a quick glimpse of his stats shows that has BABIP is .336. But, more importantly, his BABIP in 2015 was .392 and in 2014 was .354. It seems fair to propose that his defense is hurting him. In addition, his walk rate went from 8.1% in 2015 to 4.7% in 2016. This improvement has come mostly against left handed batters, as he had an 11.1% walk rate vs them in 2015 and just a 4% rate against them this year. His walk rate against righties is well-within career norms. The table below shows his overall performance.


Batters seem to have hit him hard on pitches put into play, regardless of whether the pitches have been in the strike zone or not. Batters have a .403 wOBA against pitches hit in the strike zone and a .390 wOBA (.400/.394/.500) against pitches hit outside the strike zone this year. Batters usually don’t do well when they swing at pitches out of the strike zone, and it’s not like they’re hammering home runs against him. Out of the 97 qualified pitchers, that’s the 10th worst result, although Nationals’ aces Strasburg and Scherzer are allowing a .404 and .406 wOBA against those types of pitches this year. This problem can probably be attributed to bad luck or bad defense. He ranks 32nd out of 97 against pitches put into play that are in the strike zone. This isn’t good, but does suggest that we can expect a slight bit of improvement from him. The table below shows his performance in these situations.


In addition, he’s having dreadful luck with men on base. When the bases are empty, batters have a .327 wOBA against him with a .296 BABIP, which is a bit lower than his results in previous years. With one runner on base, opposing batters have a .347 wOBA against him with a .397 BABIP. These results are slightly better than they’ve been in past years. With two runners on base, batters have a .410 wOBA against him with a .370 BABIP. In addition, Nolasco only has a 10.3% K% and a 15.4% BB%. This is far worse than his results in other seasons with the exception of 2015. With bases loaded, opposing batters have a .440 wOBA against him (.571/.444/.714) and he has gotten 2 non-sacrifice outs in play, 1 strikeout, 2 sacrifice flies, 3 singles and a double. Simply put, batters are killing him in the clutch. Nolasco historically does struggle more with runners on base than without runners on base, but it seems that he’s gotten some bad breaks to start this season.


As discussed previously, one area where Nolasco has improved is walks against lefties. The reason for this is because he’s throwing fewer balls. 35.2% of his pitches against lefties have been called balls in 2016, compared to 43% in 2015 and roughly 38% from 2012-2014. Meanwhile, his called strike rate is around career norms and his swinging strike, fouled balls and balls put into play right are above his averages. As a result, he has allowed significantly fewer walks. See the chart below.


Part of the reason for this is that he figured out how to throw his splitter again. Last year, he couldn’t throw his splitter for a strike and batters simply didn’t swing at the pitch. Nearly three-fourths of his splitters last year against lefties resulted in a ball and only 12% resulted in either a called or swinging strike. This year, 40% of his splitters result in a called ball while 22% result in a strike. He’s fixed his splitter and that’s helped him be successful. See the chart below.


In addition, he’s gotten lucky with the curve and slider. He’s throwing the same amount in the zone as he has in previous year, but lefty batters are swinging at 56.6% of them as opposed to roughly 40-45% in previous years. Therefore 27.5% of these pitches have been called balls while 31% have been either called or swinging strikes. This either means that his curve/slider have become significantly better at fooling batters or that Nolasco has gotten lucky.


My opinion is that Nolasco probably isn’t as good as his FIP suggests, but I think he’s gotten more bad luck than good luck. Going forward, I’d expect him to have an ERA in the low 4s. I also think that being behind a good defense will help him significantly. He’s under contract for only one more year after this one, so trading for him wouldn’t be a huge risk.

I don’t think it would take so much to acquire him. He does have a limited no-trade clause, but the three teams on it are the Red Sox, Yankees and Blue Jays. The Orioles probably wouldn’t be willing to take on Nolasco’s entire salary, so the first piece in a deal would have to be either Jimenez or Gallardo. The Orioles seem to be more down on Jimenez than Gallardo, so it makes sense to try to build the deal around Jimenez.

The first thing the Orioles would need to include is enough cash to pay the difference between the two players’ salaries. This will only be a few million, but every little bit counts. In addition, the Orioles will likely need to add a few prospects. Nolasco hasn’t had good results for the past few years, so they won’t be expecting much in return. This is the quintessential case of buying low on a player. I think that offering Mancini and Scott would be enough to get a deal done. However, the Twins would likely prefer one of Bundy, Wright or Wilson in a deal as opposed to Mancini being as they already have Mauer and Park. I would think that the Twins would need to add another piece, or take on some more cash to get one of those pitchers.

This trade would be a risk, but perhaps not overly much. If Nolasco doesn’t pan out, well Jimenez is already in the bullpen. Furthermore, Mancini isn’t likely to be able to hit well enough to become a DH while Scott is at best a reliever. These may be some of the Orioles’ best prospects, but they have limited value. And if the Orioles are going to make a deal, something like this is the best they can hope to pull off.

20 June 2016

The Orioles Have a Lot of Hard Payroll Decisions to Make

At first glance, it would seem like the O’s have a lot of long term flexibility in terms of payroll.  According to Cot’s Contracts, they are at $87M for 2017, $51.5M for 2018 and then all the way down to $30M in 2019.  That, however, is simply the amount of money we know is already committed, as these numbers necessarily do not factor in arbitration raises. In some ways, this is good: Not having a lot of money committed long term should allow for greater flexibility to sign extensions with current players or to go out and get free agents.
The flip side is that much of the team is only under control for two more seasons.  Here’s a list of current players who will not be under team control in 2019 as of today:


Adam Jones
Matt Wieters
Brad Brach
Zach Britton
Mark Trumbo
Yovani Gallardo
Chris Tillman
Hyun-Soo Kim
Dylan Bundy
Ryan Flaherty
JJ Hardy
Oh, and a guy you have maybe heard of.  He’s having a pretty good year.  Young shortstop, used to play third, punched a guy in the face a little while back…
The point here is not to say that the team will look different in 2019, because that’s obviously true for many teams.  The issue is that the entire core of the current team will not be guaranteed to be in Baltimore in just three seasons.  Even in 2018, the only players who are under team control from the above list are Manny Machado, Jones, and Britton.
So, what’s a road map for the team in terms of payroll going forward?  Everything should start and stop with Machado.  He’s the biggest and most important domino and the future of the franchise is largely based on whether the Orioles can retain him.  Let’s say, for the sake of this post, that the O’s can sign Machado to an extension after the 2016 season.  Let’s also say he gets something similar to what Jon Shepard proposed: 10 years, $400M, with an opt out after year 5.  Assuming there is some money deferred, I'd estimate Machado will be around a $35M per year payroll number.
Under this scenario, a Machado extension would raise the total committed payroll in 2017 to $122M, which does not include salaries for Tillman, Britton, Gausman, Brach, Caleb Joseph, or Jonathan Schoop.  Combined, those players made just over $16M in 2016.  That number could easily double in 2017.  If it does, the payroll would then be at a record high of $150M, and that does not include other, smaller arb raises, not to mention possibly re-signing someone like Trumbo, Wieters, Alvarez, etc.  If the O’s need to make moves in free agency, just inking a big Machado extension will easily push the club into the top 6 or 7 payrolls in baseball (potentially even top 5) with little to no improvement in terms of actual players. Perhaps Machado takes a reduced salary for the first year or two which will be made up in subsequent seasons, but even so, it is very difficult to imagine the O’s not running a $150M+ payroll in 2017 that may not even include their current starting catcher, RF, and DH.  

Things calm down a bit in 2018.  Ubaldo Jimenez’s deal will be off the books, as will Hardy’s and Gallardo’s (though it will require $4M total to buy them out, which is the most likely outcome).  That represents a savings of over $35M.  The problem there is that Tillman will be a free agent and will probably command a $15-20M commitment per season.  If he leaves in free agency, the rotation could be something like Gausman and... well, the rest is unclear.  It also means that the team would likely need a third baseman, a left fielder, a right fielder, and possibly a catcher.  That’s a lot of holes when you consider that, even with some big contracts coming off the books, the payroll will be around $100M (with the theoretical Machado extension) without any of those positions being filled.  This is also not taking into account potential extensions for guys like Gausman, Schoop, Bundy, etc.  

There are, of course, players that could plug these holes that are currently in the system. By 2018, Chance Sisco should be in line to make his debut. Perhaps Trey Mancini moves to the outfield or becomes a DH. DJ Stewart has had a slow start to his professional career, but as a former first round pick there's a chance he is ready to contribute in two seasons. Jomar Reyes will still only be 21 years old, but he is consistently ranked among the team's top prospects and could be in a position to move up to the big club. Pitchers like Cody Sedlock, Chris Lee, Tanner Scott, Hunter Harvey, and David Hess could be knocking on the door for the rotation as well. All of these players, however, come with the inherent risk and unpredictability of being prospects and they will almost certainly not all pan out. The O's will need to rely on their farm system to fill some of the holes on the big league roster for sure, but they will also need to go out of the organization as well.
So, what’s the solution?  It’s honestly hard to see one with the current roster and payroll.  A Machado extension after 2016 (which seems like the most likely time for it to occur, if ever) will require a huge payroll jump in both the short and medium term if the Orioles want to keep the team together.  For a team that, prior to 2016, has traditionally been closer to the middle than the top of payroll rankings this would require a pretty significant shift in philosophy.  Depending on what happens the rest of this season, perhaps they simply throw caution to the wind and go all out for 2017 but the potential repercussions of that kind of approach could be drastic.


The alternative would be to sign Machado and simultaneously rebuild by trading guys like Britton, Tillman, Gallardo, O’Day, and maybe even Adam Jones to get younger and cheaper, and in so doing build around Machado, Davis and a new crop of prospects to go along with what they currently have in the minors.
Of course, the third and most treacherous path (one that many O’s fans don’t want to contemplate) is to trade Machado for a huge haul in prospects.  To me, though, that would only be viable if they also dealt the rest of their core players as well and went into a total rebuild.  Additionally, the longer they wait the less trade value Machado will have.  Teams will certainly line up to try and trade for Machado, but the price tag would necessarily go down the closer he is to free agency and one of the biggest contracts in history.  Essentially, the O’s need to make the decision on Machado by the end of this season in order to put a plan in place to either go for broke or to rebuild and re-tool.
To me, the most viable path forward for the team to remain competitive long term is to sign Machado and rebuild at the same time.  It seems unrealistic to assume that the O’s will spend $150M+ every year, and trying to keep the current team together will absolutely cost that much and is likely to cost more.  The front office has been surprisingly liberal (at times) regarding payroll issues, so perhaps this analysis is not giving enough credit to the idea that the Orioles will do whatever it takes to win a World Series.  It would not be entirely dissimilar to what the Tigers have done for the past five or so seasons, and with some clever contract structuring it might not have to be a long term disaster.  

In the end, the Orioles are going to have to make some very difficult decisions regarding the roster and payroll in the very near future.  I see this as a feather in the team’s cap.  Without spending on ridiculous free agent contracts they have built a team that has become so good that it is almost too expensive, but their success may be the impetus for pretty drastic roster changes.  Just another reason to win the World Series this year.

17 June 2016

How Tillman Has Gotten Lucky

Chris Tillman is having a pretty good year as he’s 9-1 with a 2.87 ERA while averaging 6.05 innings per start. His FIP isn’t as favorable as it’s only 3.90, but he still ranks 18th out of 45 qualified starting pitchers in FIP and 13th in WAR. This comes as a fortunate surprise after a brutal 2015 in which he had an ERA of 4.99. How has he improved?

In an interview with Jon Meoli, Chris Tillman argued that his improvement is due to throwing his off-speed pitches for strikes. The data I’ve seen (downloaded via ESPN Stats and Information) suggest that this is indeed a factor. He’s been able to throw his curve and slider for strikes more often and therefore has forced batters to swing more frequently. As a result, his curve and slider have a combined swing-strike rate of 13.1% compared to his 2013-2015 rate of 6.6%. In addition, his changeup has been deadly against left handed batters. This helps explain why his strikeout rate is at 24.2% compared to last years’ 16.2%. More strikeouts typically result in better performance.  This chart shows his basic performance.


Furthermore, batters are doing roughly the same amount of damage on balls put into play as they’ve done in previous years. When putting the ball into play, opposing batters have a .266 BABIP against him, a .355 wOBA and a 4.5 HR% in 2016 compared to an .277 BABIP, .355 wOBA and 4.1 HR% from 2013-2015. In addition, his walk rate has increased from 8% in 2013-2015 to 9.1% in 2016. The sole area where he’s improved seems to be strikeouts. In part, I definitely agree with his assessment.

However, the change in his performance comes into better focus when we look at his performance based on whether runners are on base. His strikeout rate with the bases empty is 24.4% in 2016 compared to 17.6% from 2013-2015. This year’s rate is easily the best of the four. However, his wOBA is .334 in 2016 and just .320 in 2013-2015, suggesting that his performance is worse this year than in previous years. This can be explained by the fact that his BABIP from 2013-2015 with the bases empty was .269 compared to this years’ .297.


Tillman has improved with men on base. When there’s only a runner at 1B, opposing batters have a .247 wOBA against him in 2016 compared to a .338 wOBA from 2013-2015. This is in part due to the fact that he has an 28.8 K% and 5.1 BB% in 2016 compared to a 16.3 K% and 7.2 BB% from 2013-2015. But it’s also in part due to a .222 BABIP in 2016 compared to a .293 BABIP from 2013-2015. This explains why his wOBA in play for these situations was .373 from 2013-2015 but .310 in 2016. Certainly, he’s doing better, but he’s also getting lucky.

However, the area where Tillman has really improved is when there are runners in scoring position. His walk and strikeout rates have actually gotten worse. He has a 20 K% and a 10.7 BB% in 2016 with RISP compared to 21.8% and 7.9% in 2013-2015. But he also has a HR% of 1.30% and a BABIP of .220 in 2016 compared to a HR% of 2.2% and a BABIP of .287 from 2013-2015. As a result, his OPS from 2013-2015 with RISP was .678 and his wOBA was .295 but in 2016 his OPS was .557 while his wOBA was .258.


His wOBA in play with RISP was .257 in 2016 and .344 from 2013-2015. It’s possible that his HR% indicates improvement from 2013-2015 rather than random chance. After all, his 2013-2015 home run rate suggests that he should have allowed slightly roughly 1.7 home runs instead of the 1 home run that he actually has allowed. If so, his lower HR% accounts for 40% of his improvement while the other 60% is a result of his abnormally low BABIP.

Given that his K% and BB% aren’t particularly good, it’s reasonable to expect some regression. His OPS with RISP ranks 20th out of 99 qualified pitchers, suggesting that he isn’t unique in this regard. There were other pitchers that also have been successful in these situations despite poor strikeout and walk numbers which should be expected given the small sample sizes we’re dealing with.

It does appear that Tillman has gotten lucky with pitches put into play with RISP. He’s given up slightly fewer line drives and fly balls in 2016 compared to 2013-2015 while allowing slightly more ground balls and popups. But this dataset seems to think that Tillman has given up a .892 wOBA against popups in 2016, so it seems that there isn’t a drastic change in the type of contact he’s allowing. The drastic change is that the average FB and LD in 2016 is only doing 85% of the damage that it did from 2013-2015 while the average GB is doing only 62.5%.

Likewise, it’s worth noting that Tillman is having more success throwing all of his pitches with RISP in 2016 than he has previously from 2013-2015 and that batters are doing less damage putting his pitches in play with RISP than in normal situations.


All of this seems to indicate one of two things. The first possibility is that Tillman has discovered a way to not just improve his off-speed pitches so that they are harder to hit, but also that they’re more likely to result in outs. In addition, he’s found a way to be super-efficient with RISP and will be able to maintain a .220 BABIP with RISP. If so, then this will be a strong season for him.

The second possibility is that he’s improved his command of his off-speed pitches and thus will be able to get more strikeouts but has also been fortunate with RISP.  If this is the case, I would expect his results and thus his ERA to regress towards the mean. This probably does explain why his FIP is so much worse than his ERA and that his FIP probably more accurately describes his performance than ERA.

Of course, and especially after 2015, most fans would be happy with a 3.90 ERA from Tillman. This would certainly be an improvement and would make him a solid member of any rotation. He’ll provide some stability to a rotation that sorely needs it and is on pace to earning an all-star bid. But he also probably isn’t the ace that the Orioles need.  The Orioles shouldn't overweight his current performance when deciding to give him an extension. It looks like he’s just back to his usual of being a solid but not great starter.