Showing posts with label Home Runs. Show all posts

06 September 2017

Mark Trumbo and the Career Year

Everyone knows that Mark Trumbo was pretty great in 2016. He led the American League in home runs with 47 after being traded for a backup catcher and was a key cog on a playoff team. He was rewarded with a three year, $37.5 million contract extension in the off season, and everyone lived happily ever after. Well, ok, not really. Trumbo has struggled mightily in 2017, posting career lows in wOBA, ISO, and SLG, and will likely fall short of 30 homers, much less 40. He's also been sub-replacement level by fWAR and continues to be a DH-only option. With the rise of Trey Mancini and the continued presence of Chris Davis, Trumbo's reasonable-seeming deal now looks like a minor albatross.

So, what happened? First and most obviously, Trumbo's home run power from 2016 evaporated. 47 home runs was always going to be difficult to replicate, but a lot was made of Trumbo's supposed launch angle changes that took him from being a good power hitter to a great one. In an age in which launch angles have become a major focus for a lot of hitters, this made sense and tracked with the idea that Trumbo always had elite power but didn't take enough advantage of it. The problem, here, is that the only thing that really changed in 2016 was Trumbo's home run output. By measures like fWAR and WRC+, Trumbo had one of the least productive 40 homer seasons ever. This doesn't mean he was bad, of course, but it does show that, aside from the homers, Trumbo just didn't do much of anything else better than he'd done in the past. Consider:

Career BABIP: .288
2016 BABIP: .278
Career K Rate: 24.8%
2016 K Rate: 25.5%
Career BB Rate: 6.8%
2016 BB Rate: 7.6%

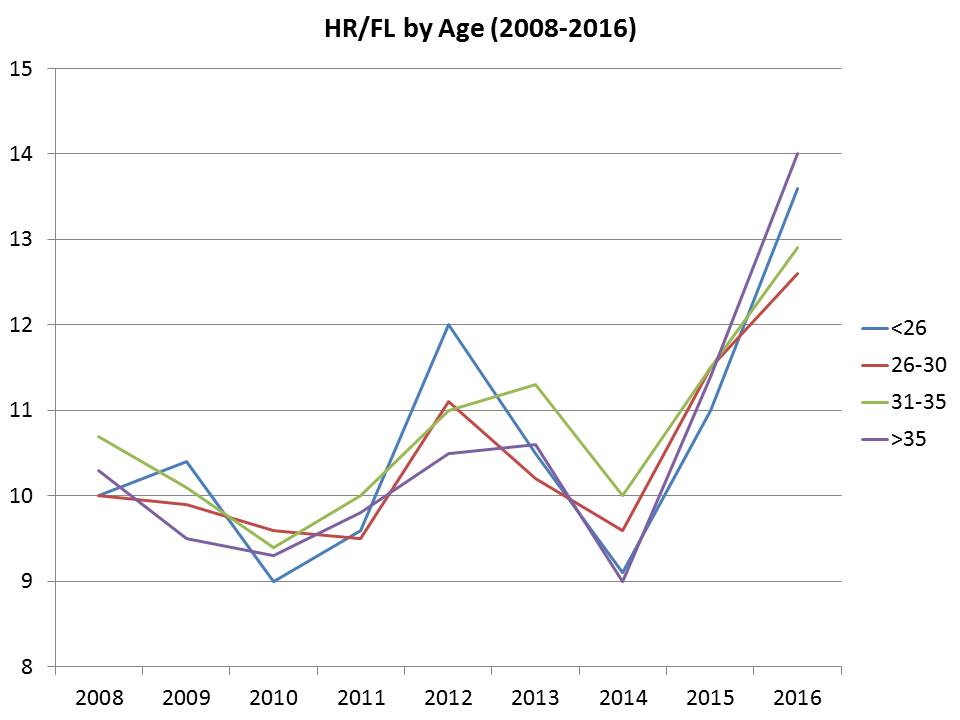
You get the idea. The one thing that did change was Trumbo's home run to fly ball rate. A ridiculous 24.6% of Trumbo's fly balls resulted in home runs, up from a career norm of just over 18%. This essentially explains the difference between Trumbo's 2016 and the rest of his career. This season, that number is all the way down to 14%, accounting for the worst isolated power and slugging percentage numbers in his career. Other than that? Things really don't look that much different. He's hitting the ball somewhat less hard than last season but is not significantly off from his career average, and his walk and strikeout rates are both better than his career.

The second thing that's happened is likely related to the first, and it's his dramatic decline in ability to handle inside pitches. The heat maps below are from 2016 and 2017, and we can clearly see that Trumbo demolished inside pitches last year but has struggled mightily this season.


The differences are stark. Trumbo has been able to effectively handle pitches on the outer half of the plate this season, but simply hasn't been able to turn on the inside pitch like he did in 2016. Worryingly, this looks similar to his career worst year of 2014.


Trumbo did rebound after 2014, but by now it should be clear that 2016 is a pretty big outlier in his career, at least in terms of his surface numbers.

Trumbo has been a bit better of late, posting an .806 OPS since the latter part of August, but even then has only hit a couple of homers. Perhaps he will buck his normal trend of having poor second halves and save his season in September, but there's still the issue of Trumbo being owed over $25 million over the next two seasons. It's fair to wonder what the Orioles saw to reward him with a relatively lavish deal, especially given that power hitters with no defensive value went extremely cheaply last off season. One has to wonder what the Orioles lineup could have looked like with a Mancini/Pedro Alvarez/other cheap lefty bat platoon situation at DH that would have cost about 1/10 of Trumbo's overall deal.

The contract was not a massive overpay at the time, but given that Trumbo is having (at best) a replacement level season means it is going to be difficult for him to live up to even a modest deal at this point. With Mancini establishing himself as a legitimate big league hitter and Chris Davis not going anywhere, the O's are somewhat stuck. It's hard to imagine that Trumbo has much trade value, and he's clearly making too much money to release or move into a part time role. At the worst, he can serve as a cautionary tale (because Bud Norris and Travis Snider didn't, apparently) about the pitfalls of paying for career years. At best, maybe he rediscovers some of that fly ball magic and powers the O's to another playoff appearance.

19 July 2016

More Home Runs are Being Hit Because of the Middle Infield

Over half the season is in the books and one major story of the summer has been that home run rates have exploded to levels akin to the early 2000s.  Some have suggested that all of a sudden that players, all of them, found a new Performance Enhancing Drug that cannot be detected.  Of course, we can logic that out about how everyone just does not start doing something and that therapy treatments are rarely effectively trailblazed by gym rats and muscleheads.  Others have proposed that millennial pitchers lack control and command, leaving balls up in the air to be clobbered.  We dealt with that last week and it seems to hold no sauce.  And then a few folks proclaimed that the ball, while legally within specs, is more juiced compared to other seasons.

I, on the other hand, will make another argument and then I will offer some conjecture.  My argument is that we are not seeing a rise in home run rates around baseball.  What we are seeing are home run rates exploding for middle infielders.  Gone are the years of Cesar Izturises and now we welcome our Jonathan Schoops.  Below is a table with HR/PA rates and percent change from 2015.

American League
2015
2016
%Change
Catcher
0.030
0.028
-5.1
1B
0.040
0.038
-4.6
2B
0.022
0.030
38.3
3B
0.032
0.037
17.1
SS
0.016
0.025
56.3
LF
0.028
0.026
-7.5
CF
0.022
0.025
13.5
RF
0.035
0.036
3.5
DH
0.035
0.041
16.3
Total
0.027
0.032
10.5
T wo/MI
0.031
0.033
4.6

A paired T-Test with Middle Infield included reaches significance at 0.03 while excluding the Middle Infield balloons it to 0.16.  Meanwhile, a comparison with the National League renders a greater jump with values of 0.0002 and 0.003, respectively.  Group it all together and both wind up as significant with 0.01 and 0.04, respectively.

Below is a graphical representation of how each position league-wide is impacted.  DH (not shown) is tucked into Total and Total without Middle Infielders.


So, the great home run explosion is largely the result of the current crop of middle infielders slugging the ball better than last year's batch.  Roughly, the leagues are seeing a 40% increase in home run hitting from those positions.  That is what is happening.  Now, some conjecture on why it is happening.

While the safe path is to simply call this a remarkable coincidence with so many  young exciting middle infielders this year, such as Jonathan Schoop, Manny Machado, Trevor Story, Marcus Semein, and Roughned Odor.  However, I wonder to what extent defensive shifts come into play here.  For instance, a player like Jonathan Schoop benefits greatly from a shift.  His main detriment is a lack of range while his greatest defensive advantage is his strong arm.  As such, he can play deeper back and utilize a shift to take advantage of his arm and reduce the impact of his limited range.  By doing this, you can get his bat in at second base when before you would need to rely on a more defensive player who likely has a worse bat.

Again, it may just be the ebb and flow of talent has decided to backwell into the middle infield. Or maybe it is a concerted effort to let guys with good bats stick in the middle infield until it is evidenced that they really do not belong there at all.  To a lesser extent, you also see the increase in other shift position like third base and center field.  If you batch position by shift impacted (2B, SS, 3B, and CF) vs. minimally impacted (C, 1B, LF, and RF), you see some stark differences.  Home run rates increased for the shift position by 25% (p=0.006) while minimal shift increased by 2% (p=0.19).

As it stands, it seems untrue to blame millennial pitchers.  It seems highly unlikely that there is some new wonder PED.  It seems curious that a new ball would impact only certain positional hitters.  It seems likely that for one reason or another players who are most employed with defensive shifts are those who also have a much stronger bat than those in years past.

14 July 2016

Matt Wieters HR Hypothesis: Blame Millenial Pitchers' Lack of Self Control

Yesterday, I heard about Matt Wieters' hypothesis about why home runs are up to potentially record breaking numbers after years of power decline.  His thought was that pitchers were being aggressively promoted as a result of fastball velocity as opposed to being able to master command of their pitches.  In other words, pitch locations were wobbling well away from the intended target and getting clobbered.  Cynically, this would be an argument a catcher might make to explain why a pitcher is at fault with a focus on pitchers with no seniority.

To test better conceptualize that, I put together a series of graphs showing home run per fly ball rates from 2008 until 2016.  If mistakes are the issue, then one would expect an increase in that rate as more pitches are squared up on.  Second, if this was an age issue, then that would become evident.  Historically, there are no significant differences between age groups.


The above graph makes it clear that all age groups have seen a major increase in home runs per fly ball.  It simply is not a youth issue and one would suspect that very few players above the age of 31 are without much experience at the MLB level.  I next broke this out into starters and relievers (not shown).  The rate follow the same shape, but with relievers 0.5 to 1.0 % fewer HR/FL than starters.  No significant differences were found for any age group for either relievers or starters.

To gauge how much of an increase we are discussing here compared to the historical (2008-2015) mean, I graphed each age group and separated them by starters and relievers.


There is a U shape here where younger and older pitchers have been more aversely impacted with HR/FL increase in rates.  Again though, all groups have observed significantly higher HR/FL rates.

With these graphs in mind, it is difficult to see much beyond the Wieters' hypothesis about poorly experienced arms making everyone look bad (or good, depending on your point of view).  After writing this up, the Washington Post took some aims at answering whether Wieters was right.  They looked into whether more home runs are being hit (they are), whether fastball velocity has increased (it has, which we have known for quite a while and actually wrote the seminal piece several years ago on this site), whether more mistake pitches down the middle are being hit for home runs (yes, which tracks with more home runs overall being hit though), and whether young pitchers are at fault (not beyond historical norms).

While looking at the batted ball data, the differences are not much and do not appear to be significant.  However, it seems that this noisy data might suggest that there is more hard hit contact and that it siphoned it from the medium hit group.

Season
Soft%
Med%
Hard%
2008
17
56
27
2009
16
57
27
2010
18
52
30
2011
24
52
24
2012
16
56
28
2013
17
53
30
2014
18
53
29
2015
19
53
28
2016
19
50
31


 Maybe this means that players are squaring up on the ball better.  I do not know.

Another idea is that perhaps teams are embracing more uppercut style hitters as the league embraces more groundball pitching.  How does that pan out?

Season
LD%
GB%
FB%
2008
20
44
36
2009
19
43
38
2010
18
44
38
2011
20
44
36
2012
21
45
34
2013
21
45
34
2014
21
45
34
2015
21
45
34
2016
21
45
34

 Honestly, if you had told me that the last five years have resulted in a leveling off of batted ball profiles and that we are seeing levels lowers than the pre-PED testing era.  All in all, I am at a bit of a loss.  Perhaps teams and players are more effective with changing swing planes, but I am doubtful of that.  Perhaps the ball is both legal and accidentally a little juiced this year.  Regardless, I do not think Wieters' hypothesis about millennial pitchers works.

16 September 2014

How I Learned to Stop Worrying and Love the Bomb

The Orioles are expected to clinch the AL East any day now so it makes sense to focus on the playoffs. One of the concerns about the Orioles in the playoffs is how our offense is reliant on the home run. Patrick Dougherty from Baltimore Sports and Life argued that this isn't a problem in this article. I figure it makes sense to write what seems to be an annual article taking a closer look.

A team that hits a home run is more likely to win a game than a team that doesn't. After all, runs scored via home run are just as valuable as runs scored via a different method. And if you score enough runs then you will win. One would expect a team that hits a home run in a game to win more often than a team that doesn't hit a home run. One way to see whether the Orioles are reliant on the home run is to compare their winning percentage when they don't hit a home run to the league average. Here's a chart.


2005-2014 2014   Orioles 2014
W 6,511 706 15
L 12,326 1,196 29

0.346 0.371 0.341

The average team from 2005 to 2014 won about 34.6% of the time when they didn't hit a home run. In 2014, the average team won 37.1% of the time while the Orioles only won 34.1% of the time. The Orioles have won about 1.5 fewer games than expected when haven't hit a home run. Given that our sample size is only 44 games this could be nothing more than a coincidence.

In contrast, the Orioles seemingly do very well in comparison to other teams when they hit at least one home run. As the graph shows, the average team wins nearly 60% of the time but the 2014 Orioles have won over 70% of the time.


2005-2014 2014   Orioles 2014
W 17,561 1,498 73
L 11,746 1,008 31

0.599 0.598 0.702

It seems clear that the Orioles do better than the average team when they hit a home run and do worse than the average team when they don't. It gets better because the 2014 Orioles have hit a home run in 70.3% of their games compared to the 2014 league average of 56.9%. The 2014 Orioles hit home runs more frequently than other teams and have a higher winning percentage when they do so.

The Orioles have a  .595 winning percentage and it may make sense to compare them to similar teams rather than the average team. This is complicated because the Orioles have hit a home run in 70.3% of their games while the average team hits a home run in 56.9%. It makes sense that teams with a higher winning percentage hit home runs in more of their games than the average team. It also makes sense that teams with a higher winning percentage would win a larger percentage of their games when they do or do not hit a home run compared to the average team. In order to compare them to a similar team it makes sense to account for both variables. The problem is that it's extremely difficult to do this using the Baseball Reference play index.

What is possible to do is determine how a team that has a .595 winning percentage would be expected to perform if it hit a home run in 57% of its games, if it hit a home run in 63% of its games and if hit a home run in 70% of its games. I can do that by determining how a team that wins an average amount of games would perform if it hit a home run for each of these three percentages and then simply multiplying by .595/the new winning percentage. So for example, a team that hit a home run in 70% of its games and won 60% of the games where it hit a home run and 37.1% where it didn't would win 53% of the time. So, I could figure out how a team that hit a home run in 70% of its games plus had a winning percentage does by multiplying the average win percentage by .595/.530. Here's a graph.


57% 2014 63% 2014 70% 2014 Actual 2014
No HR 0.441 0.43 0.416 0.341
HR > 0 0.711 0.692 0.67 0.702

This indicates that the Orioles win more often when they hit a home run than the average team with a .595 winning percentage and that the Orioles win considerably less often when they don't hit a home run. The average .595 team would probably go around 19-25 when they didn't hit a home run while the Orioles went 15-29. It seems that the Orioles are more dependent on the home run than the average team with a .595 winning percentage.

It seems that the Orioles do better than expected when they hit a home run and worse than expected when they do not. How does this translate to the post season?  The graph below shows how teams have performed from 2005 to 2014 when hitting a home run and not hitting a home run in both the regular season and post season.


No HR HR > 0 Chances of Hitting a HR
Regular Season 0.346 0.599 0.609
Post Season 0.36 0.586 0.619

Teams that do not hit a home run are slightly more likely to win in a post season game than in a regular season game. Teams that do hit a home run are slightly less likely to win in a post season game than in a regular season game. But the difference is minor. A team that hits a home run in either a regular season or post season game is likely to win and a team that doesn't is likely to lose.

It seems that the Orioles are likely to win the AL East and should be expected to face the winner of the AL Central in the first round of the playoffs. The following charts show how the Royals, Tigers, Orioles, and the average wins for each pitching staff when they allow at least one home run and when they don't.

 
Royals HR = 0 HR > 0
Orioles HR = 0 HR > 0
W 47 34
W 36 52
L 26 41
L 20 40

0.644 0.453

0.643 0.565


Tigers HR = 0 HR > 0
All HR = 0 HR > 0
W 44 38
W 1202 1018
L 20 46
L 711 1509

0.688 0.452

0.628 0.402

The Royals and Tigers are slightly above average when allowing a home run but lose the majority of their games. But the Orioles seem to have a secret ingredient that allows their pitching staff to give up home runs and still win.

Hitting home runs is a good thing and are even more likely to happen in the post season than in the regular season. Teams that can't hit home runs in the postseason are going to be in trouble. And if you're facing the Orioles then hitting home runs simply isn't enough. The Orioles overachieve when hitting home runs and underachieve when they don't. So, worrying about whether the Orioles are overly dependent on hitting home runs is a mistake. I recommend not to worry about whether this team hits too many home runs and just learn to love the bomb.

(Stats are accurate as of Sunday 9/14)

15 July 2014

Dissecting J.J. Hardy's Homer Drought

For a player whose offensive value is all but predicated upon the long ball, the lack of pop coming out of J.J. Hardy's bat this season is troubling. Finally getting off the schneid June 21st with a home run off of a 95 MPH fastball, Hardy has followed up this long fly with two more, bringing his home run per flyball rate (HR/FB%) up to 2.9 percent, putting him in the hallowed homer company of Ben Revere (2.9%) and Austin Jackson (3.0%). Sarcasm aside, the dearth of home runs currently has Hardy—whose 25 home runs last season tied him with Troy Tulowitzki for the most hit by a shortstop, and his 12.4% HR/FB rate ranking third for shortstops last year—hitting at a .298 weighted on base average (wOBA) and 84 weighted runs created plus (wRC+), both of which are slightly above American League average for shortstops (.293 wOBA and 83 wRC+). Combine this with a career-worst 3.8 percent walk rate and a slight hike in his strikeout rate (15.7%) compared to last year and his career (14.3% and 11.3%, respectively) and it becomes obvious that Hardy's normal sources of production are beginning to run dry.

There are myriad reasons for Hardy's power outage—injury, age-related declines, a loss of bat speed, a change in how he is being pitched, changes in his batted ball rates, perhaps a change in hitting approach—all of these variables that could be at the root of the problem, working alone, or in unison. While we don't have access to all of the information that could determine whether some of these factors are realistically a piece of the homer puzzle for Hardy, we do have batted ball and PITCHf/x results to work with, which can help discern whether the problems are more hitter- or pitcher- derived. Using last season for comparison here and moving forward, let's start by looking at pitch type linear weights (here, we use PITCHf/x-derived pitch values per 100 pitches) of the pitches Hardy has seen; the more positive a number, the more success Hardy has had with a given pitch:

Season wFA/C wFT/C wFC/C wFS/C wSI/C wSL/C wCU/C wKC/C wCH/C wKN/C
2013 -0.16 0.56 -2.01 -7.48 2.02 -0.68 3.53 -2.25 -0.28 8.14
2014 -0.83 -1.36 -1.76 -1.68 1.05 2.06 1.71 -5.5 -1.02 -10.08
Career -0.24 -0.16 -0.94 -2.57 -0.43 -0.2 0.3 0.58 0.35 5.42

 FA=fourseam fastball, FT=twoseam fastball, FC=cutter, FS=split-finger fastball, SI=sinker, SL=slider, CU=curveball, KC=knuckle curve, CH=changeup, KN=knuckleball

Here, we see a slight decline in Hardy's success with fastballs, especially fourseamers, twoseamers, and to some extent, sinkers; cutters and split-finger fastballs are still problematic (hence, the negative values), but this year appear to be less so than in years past. Sliders appear to be quite improved in terms of Hardy being able to put a good swing on the pitch, with this and the decline in fastball success perhaps a tacit indication that the bat speed might be starting to decline in 2014. 

Staying with PITCHf/x data, let's now turn attention to how often these pitches are seen by Hardy, which will also provide more context to what's he seeing, pitch-wise, as it is one thing to do poorly against a certain pitch, but only see the pitch once or twice a season:


Season FA% FT% FC% FS% SI% SL% CU% KC% CH% KN%
2013 35.70% 15.60% 6.40% 1.20% 8.20% 14.50% 5.50% 0.50% 10.60% 1.00%
2014 38.30% 17.30% 5.20% 1.40% 7.40% 15.80% 6.10% 0.80% 7.20% 0.40%
Career 44.90% 9.10% 4.40% 0.70% 5.70% 16.70% 8.10% 0.20% 9.40% 0.40%

Hardy is seeing slightly more four- and twoseamers than last year, with a concomitant rise in sliders and curveballs seen; it appears that Hardy is making the most of the increased number of sliders he is seeing, but is doing so at the cost of less success against the hard stuff so far this season. 

So far, we have found some slight deviations in how pitchers have gone about getting Hardy out; have these changes been reflected in the batted ball data, aside from the homers?


Season LD% GB% FB% IFFB% HR/FB IFH% BUH%
2013 16.60% 45.20% 38.20% 14.40% 12.40% 8.40% 0.00%
2014 17.70% 43.90% 38.40% 16.30% 2.90% 8.40% 50.00%
Career 16.90% 44.40% 38.70% 13.30% 10.80% 7.40% 15.40%

LD=line drive, GB=ground ball, FB=fly ball, IFFB= infield fly ball, IFH=infield hit, BUH=bunt hit 

In a word, no; the Hardy of 2014 appears to be the same as the Hardy of 2013, at least by his batted ball rates, outside from HR/FB. The rise in bunt hits seen this year is courtesy of two bunt hits, compared to zero laid down in 2013. The more commonly referenced and researched numbers of Hardy's 2014—line drive, ground ball, and fly ball rates—are all within a percentage point or two of last year's rates, which saw him enjoy his typical homer-heavy production. Going one step further and calculating fly balls per popup, which provides a rough estimate of how hard a player is hitting the ball—and the results indicated that perhaps it isn't so much the batted ball type at play with Hardy's homer drought, but more the quality, with respect to how hard it's being hit. 


Season FB% IFFB% FB/PU
2013 38.20% 14.40% 2.65
2014 38.40% 16.30% 2.36
Career 38.70% 13.30% 2.91

Overall, Hardy's FB/PU is fairly pedestrian compared to the likes of a slugger like Chris Davis, whose current FB/PU sits a 6.59. However, we do see it in decline, sitting at 2.36, his lowest rate as an Oriole; in his Oriole years, Hardy has averaged a 3.0 FB/PU rate, suffering a career-low 2.05 FB/PU in 2006, while with the Milwaukee Brewers.

Setting aside the tables for a moment, let's look at where in the strike zone Hardy's homers have been hit this season and last, splitting out pitcher handedness:


 While we don't have much 2014 data to hang our hats on, we can use 2013 as a template—Hardy does the most damage on fastballs (here, I collapsed all fastball types into a single 'FA' variable) up in the zone, essentially over the middle of the plate, from righthanded pitchers. Through Brooks Baseball and with a focus on fastballs, we can compare where righties are pitching to Hardy to see if they've become cognizant of this trend and have begun to avoid the high fastball; on the left is 2013 data, on the right, 2014:


Pitchers have appeared to maintain the same or at least a similar approach to getting Hardy out with respect to pitch location, with no significant swings in fastball location from last season to now. 

Using the same PITCHf/x tools, let's take a look at Hardy's tendencies; here, we look at his popup rates over the last season and a half on fastballs from righties:


It appears Hardy has had a little tougher time this year putting a good swing on fastballs in the heart of the plate and slightly elevated, his homer 'sweet spot'. While the statistics previously presented have shown that he has been able to counter some of this in the greater scheme of things offensviely, given that his line drive and fly ball rates have been fairly par for the course in 2014, the PITCHf/x data alludes to a possible slowing of the bat for Hardy, paired with a propensity for hitting balls with less authority this year. 

For Hardy, the sudden decline in his bread and butter offensive weapon is jarring and is made all the more discouraging, given his less than optimal walk rates and ability to hit for average. While the Orioles shortstop still has the potential to finish the season as an above average offensive contributor, the numbers are pointing to the days of 20+ homer seasons being over, unless adjustments are made in his approach.


*** 
Data courtesy of Baseball Savant and FanGraphs, unless otherwise noted.

24 September 2013

Do the Orioles Hitters Have a Home Run Problem?


Yesterday, Steve Melewski of MASN wrote about the Orioles recent problems on offense.  These problems aren’t all that recent though.  Since the beginning of September they’ve only averaged 3.7 runs per game while hitting .228/.286/.372 (AVG/OBP/SLG) as a team.  One of the problems that Melewski states is that the Orioles have been struggling on offense because they’re too one-dimensional.  The problem according to Melewski is that, “the Orioles are too reliant on the home run and they need more variety from their offense”.  

He’s not ENTIRELY wrong, but scoring runs via home runs should never be a problem.  Every year, you’ll hear about a team who hits too many home runs, and this year it’s the Orioles.  This isn’t the first time this has been said about the 2013 Orioles, but the rhetoric has picked up as the Orioles continued to fight for a playoff spot, while their offense has endured its worst month of the season.  

Melewski goes through some offensive statistics, comparing this year’s team with the playoff team from 2012, and as he shows, the 2013 offense is basically better than last year’s version in essentially every category, except for on-base percentage.  And that is the real issue.  What follows certainly isn’t groundbreaking analysis.  I’ve highlighted where the Orioles are specifically located on each graph, along with the Red Sox and Cardinals.


As you can tell (and probably already knew), a high OBP correlates better to scoring runs than hitting home runs, as evidenced by the corresponding R2 values (the closer to 1, the better the correlation).  The Orioles appear to be enough of an outlier in the second graph that they should consider themselves lucky to have scored the 5th most runs in the majors. If Baltimore’s runs scored correlated approximately with their OBP (according to this model), they should have scored right around 600 runs, which would give them a Pythagorean win-loss record of 69-86.  These correlations change slightly from year to year, but the underlying fact remains the same, as you can see from a sample of correlations from previous years.


The fact that Orioles hit a lot of home runs isn’t the reason that their offense has gone cold.  The reason is that they don’t consistently get on base (.311 OBP compared to a league average OBP of .318).  If more of Baltimore’s home runs had been hit with men on base, you could bet that relying too much on the home run would not be considered a problem.