Showing posts with label UZR. Show all posts

06 November 2017

The Orioles Need Better Outfield Defense

The Orioles outfield defense was considered poor by defensive metrics. Per Fangraphs, the Orioles outfield had a UZR of -21.1 runs, ranked 29th out of 30 teams. I’ve been known to be skeptical of UZR in the past, but this year UZR has just three teams with an outfield defense worse than 10 runs (1 win) and six with an outfield better than 10 runs. This is a significantly different from other years, suggesting a drastic change in methodology. Statcast’s outs above average metric tells a similar story as it ranked the Orioles outfield defense as worth -15 outs above average, tied for second worst in the majors. According to its sprint speed metric, the Orioles outfield was very slow and this helps explain its ineffectiveness.

Adam Jones has been the foundation of the outfield defense for the past ten years. He’s been fast enough to play center field while having above average offensive production. But good things can’t last forever and Jones has finally faded defensively. Statcast ranked Adam Jones as being worth -7 outs above average, 201st out of 210 outfielders. The reason why he was so ineffective was because he’s now slow. Per Statcast, his sprint speed was only 27.1 feet per second ranking 53rd out of 58 center fielders. It isn’t clear whether his defensive positioning had a detrimental impact on his speed, but this suggests that he needs to be a corner outfielder going forward. This could be problematic because his bat isn’t good enough to make him any better than an average right fielder offensively. Depending on his 2018 performance, the Orioles probably shouldn’t offer Jones a qualifying offer, nor should they extend him unless he signs a short-term deal at a significant discount from his current contract. There’s only so much a team should pay for leadership.

Fangraphs ranked Trey Mancini’s outfield defense as being worth -7.9 runs per 150 innings while Statcast valued him at -5 outs above average. Trey Mancini ranked 39th out of 58 left fielders with a sprint speed of 26.9 feet per second. That’s probably fast enough to play left field for the next few years, but it does mean he’ll need defensive help. With Trumbo and Davis on the squad for the next two years, Mancini will be forced to play left field barring an injury or a platoon.

Fangraphs ranked Trumbo’s outfield defense as being worse than -10 runs per 150 innings, while Statcast valued his defense as -5 outs above average. Mark Trumbo was graded as a DH, but had a poor sprint speed of 26.3 feet per second. Trumbo clearly has no business playing in the field, but his inability to hit as a DH suggests that he needs to play in the outfield. A center fielder with good speed and range can make up for Trumbo’s inability to run, but that center fielder isn’t Adam Jones at this point in his career.

Fangraphs ranked Smith’s outfield defense as being worth -5 runs per 150 innings and he ranked 49th out of 51 right fielders with a sprint speed of 26.4 feet per second. Seth Smith is a free agent this offseason and will likely not be a factor in the Orioles’ 2018 plans. However, his limited speed certainly contributed to the Orioles outfield defensive woes.

There is limited help on the roster. Chris Davis, with a sprint speed of 25 feet per second, was the 45th slowest out of 48 first basemen and now is about as fast as Matt Wieters. Davis has played in the outfield before, but can’t do so in the future if he is so slow. It would make sense to use him as a DH at this point. Austin Hays has had limited playing time as a major league outfielder, but had poor defensive results according to both Fangraphs and Baseball Reference as a right fielder. Statcast doesn’t have enough information to have a useful opinion of his speed/defense. He appears to be a defensive upgrade over Mancini/Trumbo but still below average.

The sole bright spots were Rickard and Gentry. Joey Rickard ranked 28th out of 51 right fielders with a sprint speed of 27.5 feet per second and Craig Gentry ranked 5th out of 51 right fielders with a sprint speed of 28.5 feet per second, suggesting that Gentry would be a valuable pickup on a minor league contract. However, Rickard’s .241/.276/.345 line suggests that he’s most valuable as a defensive replacement/pinch runner. In addition, he’s merely bad against left-handed pitching, suggesting that he could even be a platoon outfielder in a pinch. 

Camden Yards isn’t a large outfield, but even the Orioles need some outfield speed in order to play adequate defense and it is unlikely that anyone on their roster can provide that speed with acceptable offense. This will have to be a factor when the Orioles look at free agent outfielders if they want to improve.

The Orioles have been linked to Carlos Gonzalez, and MLBTR predicts that the Orioles will sign him for 1 year and $12 million. This would be a poor decision as Gonzalez’s sprint speed ranks 45th out of 51 right fielders at 26.6 feet per second. Not only is Carlos Gonzalez extremely slow, but he was ineffective last year against left-handed pitching with an .206/.241/.321 line with a 3.6% walk rate and a 30.7% strikeout rate. He was decent against left-handed pitching in 2016, but was terrible against it in 2015. With his limited speed, I’d expect his BABIP to plummet in future years. At this point in his career, he’s a defensively challenged outfielder that can only play against right-handed pitching. This has value to some teams, but the Orioles should probably pass given that they already have speed challenged players like Mancini, Davis and Trumbo on the roster and are lacking a fast center fielder to make up for their inability to cover ground.

Curtis Granderson is another player linked to the Orioles, but his sprint speed ranks 57th out of 58 center fielders at 26.6 feet per second. In addition, his low BABIP of .228 in 2017 and .256 in 2016 suggests that his speed is perhaps slower than it seems or that he’s vulnerable to shifting. In any event, he’s not fast enough to help solidify the Orioles’ defense playing right field.

A number of other free agent outfielders have the same issue. Jay Bruce might be an interesting addition, but his sprint speed is 47th out of 51 right fielders at 26.5 feet per second. Jonathan Jay is an interesting option, but his sprint speed ranks 56th out of 58 center fielders at 26.6 feet per second. Cameron Maybin ranks 43rd out of 58 center fielders with a sprint speed of 27.8 feet per second. Austin Jackson ranks 46th out of 58 center fielders with a sprint speed of 27.6 feet per second.

Maybin and Jackson are potentially decent corner outfield options with the ability to help the Orioles defense improve its range slightly. Neither of the two are considered top 50 free agents by MLBTR, while BORAS thinks they’ll each receive roughly 2 years and $20 million. 

Carlos Gomez ranks a passable 36th out of 58 center fielders with a sprint speed of 28.1 feet per second, but that’s a significant drop from his 2016 speed of 28.7 feet per second and his 2015 speed of 28.5 feet per second. At 33, one needs to wonder how long his speed can hold up. MLBTR projects him to earn 2 years and $22 million while BORAS has him at 3 years and $31 million. Gomez has been better against right-handed pitching than left-handed pitching over the past three years and could be platooned with Rickard. He’s a definitely reasonable free agent option for the Orioles.

At 32, Lorenzo Cain is one of the fastest runners in the majors with a sprint speed of 29.1 feet per second and would almost definitely help the Orioles outfield defense. He’s been above average offensively in the past and would be a strong leadoff option. MLBTR and BORAS are nearly in agreement about what Cain will earn, roughly $65-70 million over 4 years and will likely receive a QO. The Orioles will need to decide whether they can afford to sign him and whether it’s worth giving up the draft pick necessary. They’ll also have to see how long they think Cain can retain his elite speed.

Jarrod Dyson is another fast runner with a sprint speed of 28.8 feet per second. Jon recommended signing him in his final blueprint, and I think that he’d make sense. BORAS projects Dyson to earn a prohibitive 3 years and $32.5 million, but MLBTR has him receiving 2 years and $12 million. Dyson is old, but is above average defensively in center field and would allow the Orioles to use Jones in right field. Dyson historically struggles against left handed pitching, making him a viable platoon option with Joey Rickard. The Orioles almost certainly won’t offer 3 and $30 million to Dyson, but offering 2 years and $15 million would be an offer I could see them make. Dyson should be the Orioles first choice given their payroll situation and the fact that they need three new starting pitchers even if Cain is the better player.

The Orioles outfield defense was poor last year because their outfielders were slow. Their outfielders are only getting older and slower and so their defense will only continue to degrade without adding talent from outside the organization. Signing a player like Jarrod Dyson, Carlos Gomez and Lorenzo Cain would be a definite upgrade to the Orioles’ outfield defense and help them compete in 2018.
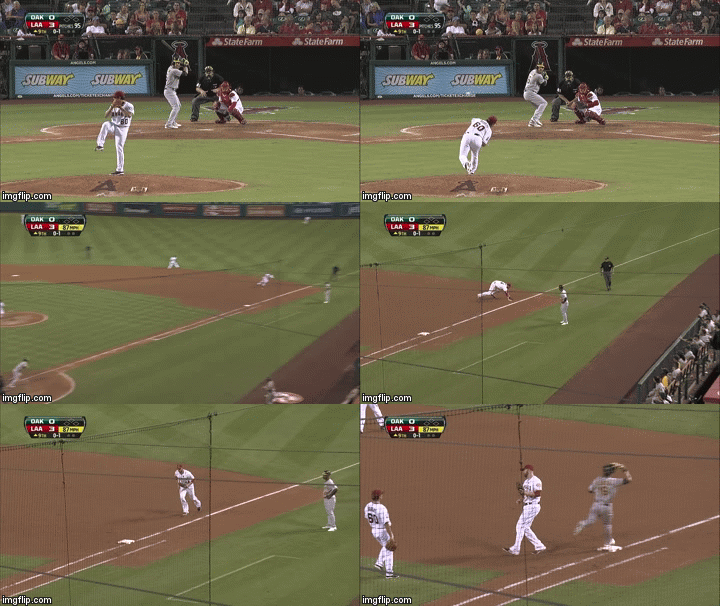
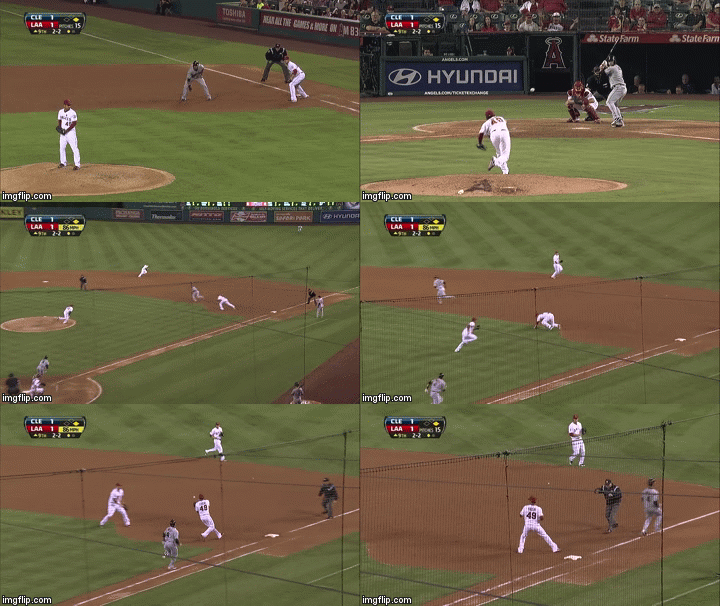
12 May 2016

A Closer Look At Joey Rickard's Defense

If there's anything surprising about Joey Rickard so far, it's been that his bat has been decent but his glove has been underwhelming. At the very least, Rickard was supposed to provide a decent outfield glove as a fourth outfielder type. Instead, he's been installed as the team's everyday left fielder and leadoff hitter.

Right now, Rickard has a wRC+ of 99. The league average left fielder also has a wRC+ of 99. However, the average leadoff hitter has a wRC+ of 109. I've been critical of Rickard offensively and still don't quite understand why he's being used the way he is, but at the plate, he's been fine for now. Getting league average offensive output from Joey Rickard is perfectly acceptable. And it's not surprising or a knock on him at all that he's in the bottom half of leadoff hitters in terms of production. He has not been a disaster there by any means, but he hasn't been great. So it's a little strange that he has such a stranglehold on the leadoff spot in the lineup.

Still, in terms of wins above replacement, Rickard rates negatively. The driving force there by Fangraphs' and Baseball-Reference's versions of WAR (currently -0.3 in both) is his poor early defensive ratings (and a tiny slice is that he has done some bad things on the basepaths). Rickard has spent a decent amount of time in all three outfield positions, and he's amassed a UZR of -6.5 (UZR/150 of -33.9) and a DRS of -6. Now, it's tough to state definitively what exactly a full season's worth of defensive metrics actually means, let alone about 250 innings. So who's is to say that Rickard can't improve, or isn't at least close to average?

But I don't think it's unfair to say that while he's made a few nice plays in the field, Rickard has not come as advertised with the glove. In his time in the minors, Rickard logged more than 1,000 innings each in center field and right field. In left field, he logged more than 500. So he's had a lot of experience. Still, playing competent defense at the major league level is an entirely different animal.

All right, so let's get to some examples. Here's one of Rickard's first tough chances on the season. Take a look:
View post on imgur.com

You'll notice a few things. First, it was a nice effort, so that's something. The ball was just out of his grasp, and it would have looked pretty nice were he to have made the play. You'll also notice that Rickard didn't take the best route to the ball, and that also it maybe wasn't the best decision to dive and take a chance. Yes, of course it's easy to say that after the fact. But that's what happens with split-second decisions. Flashy plays always look impressive, but sometimes just keeping the ball in front and avoiding mistakes is the job of an outfielder. We'll revisit Rickard's route-taking and decision making.

A day later, Rickard had a semi-tough chance on a ball in front of him:
View post on imgur.com

I think even Rickard would tell you that he should have caught that ball. But wait, the play isn't over.
View post on imgur.com

Rickard stayed with the play, gathered the ball, and rifled it home to nab the runner. Nice throw.

Here was a pivotal play in a tie game:
View post on imgur.com

Rickard struggled with the transfer and ended up double-pumping before unleashing a throw too late to catch the runner at home. Maybe it's a bit unfair to be too harsh on this play; the weather was wet, and that didn't make things easy. But Adam Eaton was just rounding third when Rickard scooped up the ball, and it wasn't like the throw was coming from deep in the outfield.

Here was a decent play by Rickard on a line drive to right-center:
View post on imgur.com

One thing to pay attention to on hits to the outfield is how quickly a fielder reacts to a ball, particularly a line drive. When the camera shifts to the outfield after a hit, you can tell if a fielder is slow to react and/or gets a bad read. If the fielder is already off and moving -- in the right direction -- then that's a great sign. In the play above, Rickard is already moving. The ball carries a bit more than Rickard anticipates, so he has to jump at the last second to snag the ball. Maybe he got a little lucky, but that ball was also roped.

In a late-game play against the Yankees, Rickard misplayed a carom off the wall in right field:
View post on imgur.com

There's not much to say here, as it seems like he just missed the ball. But these little things add up.

Among the GIFs in this post, here is what I think is Rickard's second-best play:
View post on imgur.com

He reacts to the ball off the bat relatively quickly, though he doesn't take a direct route to the ball. Again, line drives are tricky. But even though he hasn't had a bunch of difficult chances yet, less than ideal routes to the ball will make it hard for Rickard to truly utilize his speed and run down tough chances.

But here's my favorite play from Rickard so far:
View post on imgur.com

Plays like that make me think there's still time for Rickard to show he can be a competent outfielder. Considering how he was described when the Orioles selected him in the Rule 5 draft, I expected Rickard to be a little more polished in terms of reads and routes. But he is a rookie, and he at least won't be asked to play center field unless Adam Jones gets hurt again. Besides, Rickard's arm is OK, but it plays much better in left field.

-----

I think the Orioles are still trying to figure out what they have in Rickard. If I had to guess, I would say he'll regress a bit with the bat and improve with the glove. I'm more than happy to be wrong that he shouldn't be playing every day, especially as the team's leadoff hitter. Still, at 20-12, the O's are in no position to panic or really change anything. That's probably not what Hyun Soo Kim or Nolan Reimold want to hear.

Regarding Rickard's outfield defense, it's evident that speed is not everything. Clearly being fleet of foot helps an outfielder, but reading the ball off the bat and taking an efficient route to a fly ball or line drive is more important. It's also key to pick and choose the right spots to lay out for a ball. These are things a rookie may learn, but there's no guarantee of that, either.

08 January 2016

The Challenge Of Quantifying Outfield Defense

A few weeks ago, a commentator asked whether the Orioles should consider having Wieters play in the outfield. Jon asked for predictions of Wieters defensive ability as an outfielder via twitter and 54% of respondents thought he’d have a -50 UZR/150. While the Orioles' aren't going to use Wieters in the outfield, this discussion piqued my interest because that is a large amount of runs for a corner outfielder to concede.

UZR seems to suggest that such an outcome is reasonable. Hanley Ramirez was terrible defensively last year in LF and had a -30 UZR/150. Manny Ramirez had a few years where he had a -30 UZR/150 in LF. Unlike these players, Wieters has no experience playing in a corner outfield position and could very possibly struggle to make even simple defensive plays. If the worst corner outfielders are worth -30 runs, then Wieters could be worth -50 runs.

On the other hand, there are a limited number of balls hit to corner outfielders in a game and most of them are either easy or impossible plays. According to Inside Edge Data, only 40 to 50 balls hit at corner outfielders per season are even in question. A defensive outfielder would need to consistently botch the easiest plays that require minimal range to be worth 50 runs below average. Even a slow professional baseball player would be challenged to perform that poorly.

For context, Chris Davis’ offense was ranked at only 40 runs above average and Machado’s offense was ranked at 30 runs above average meaning that having Wieters in the outfield would have the same impact as replacing Machado's offense with a league average third baseman.

Furthermore, Machado is an excellent fielder and is only about 10 runs above average defensively at third base.  Simmons is an excellent shortstop and is usually 20 runs above average defensively. If UZR values the worst corner outfielders as worth -30 runs defensively, does this mean that there's a problem with UZR? It seems difficult to see how an experienced corner outfielder could cost his team that many runs.

Fangraphs argues that WAR works because there is a strong correlation between a team’s total WAR and their actual record. Glenn Dupaul from the Hardball Times argues that if WAR does a correct job at explaining where wins come from, the linear regression equation should have an intercept equal to roughly replacement level (47.7 wins) while each WAR should be worth roughly one win.

When I did this test with data from 2002-2015, the resulting formula returned had an intercept of 47.6 wins with each WAR being worth 1.00093 wins. When I split WAR into pitching and position WAR, the resulting formula was 46.84+.89*Position WAR+1.20*Pitching WAR which has interesting implications when thinking about this article. In any event, there can no debate about whether WAR works even if it could potentially be improved.

This is relevant because UZR is part of the WAR formula. One way to determine whether UZR works is by breaking WAR up into its components and seeing whether UZR is a significant factor for predicting teams’ total wins. I did such a test using a stepwise regression and found that it is significant. It was the third most important factor behind pitching and hitting although considerably less important than either of the other two. This implies that UZRs’ efficacy is limited, but still better than nothing.

The next question is whether UZR works for each position and specifically LF or RF. For this test, I input each teams’ defense score at each position (in order to replicate this it’s necessary to grab the data from the Fielding Tab rather than the Batting Tab at Fangraphs) for each team and season.  For most positions, UZR is helpful. Surprisingly, first base defense seems to have the highest correlation with wins (which possibly implies something about how defense is measured at other positions), while third base and center field data are also helpful. Data from shortstops, catchers, left fielders and right fielders are less helpful but still add some certainty. Surprisingly, second base defense as measured by UZR doesn’t add predictive power to the model.

The last question is which aspects of UZR are relevant for each position. Just because one aspect of UZR is relevant for a given position doesn’t mean that all of the aspects are relevant. In order to test this, I used each teams’ range, error, arm and double play range for each position to see which ones can be used to model wins. None of these factors apply to catchers and therefore this method can’t measure their performance.

My results suggested that range is relevant for first basemen, third basemen, center fielders, shortstops, extremely minimally for second basemen and has no relevance for corner outfielders. This is problematic because range is the largest component to UZR and therefore suggests that defense values for three positions are valued improperly and in a format that doesn't help us predict team wins.

Likewise, errors are only relevant for third basemen and shortstops. The average team’s left fielders have 5.2 errors over a season. The 75th percentile is 7 errors while the 25th percentile is 3 errors. Right fielders average 5.75 errors over an entire season with the 75th percentile having 7 errors and the 25th percentile having 4 errors. Even if an outfield error costs a team .8 runs, that still means errors from left fielders cost most teams about three runs a season and about two runs for right fielders.  Similar stories can be told for center fielders (average=4.8, 75th percentile = 6, 25th percentile = 3), first base (average = 10, 75th percentile = 13, 25th percentile = 7) and second base (average = 13, 75th percentile = 16, 25th percentile = 10).

The only statistic that is relevant for corner outfielders is arm strength. This would work for a player like Wieters as he’d likely struggle with range and errors but has a strong arm. It also means that teams are right if they discount UZR range values for corner outfielders and players like Heyward could be overvalued due to possibly overvalued defensive ratings.

The bottom line is that it is hard for us to accurately measure corner outfield defense and therefore can't determine how much damage a bad defensive outfielder inflicts on his team.

07 December 2015

Is Mark Trumbo A Good Defender At First Base?

If you're going to acquire Mark Trumbo, then you're getting him for his bat. He has a career 108 wRC+, which means he's been 8 percentage points better than league average at the plate over the course of his career.

Specifically, though, you want his power in your lineup. In parts of six seasons in the majors, Trumbo has hit 131 home runs and has an isolated power of .208. I mentioned this the other day, but in the past three years, Trumbo is 24th among qualified players in isolated power. For reference, Chris Davis is first. Adam Jones ranks 23rd. Trumbo is strong, and he hits the ball far. That's valuable.

There's not much up for debate about Trumbo's offensive abilities. He's a high slugging, low on-base percentage hitter, and that's just fine. Most teams, especially American League ones, have room for Trumbo in their lineup.

But what about his defense? If we've learned anything about how to value players, it's that everything matters. And we know that Trumbo is a bad defensive outfielder, so hopefully he doesn't end up playing in left or right field often for the Orioles. His bat would make using him there tolerable, but it's not optimal strategy. Besides, Chris Davis very well may sign with another team, which would open up plenty of work for Trumbo at first base. So is he a good defensive option there? In Tuesday's trade write-up, I took a quick look at his defense both at first and in the outfield according to Ultimate Zone Rating (per 150 games) and Defensive Runs Saved. Let's break it down per season:

YearInningsUZR/150DRS
20103341.61
20111,2575.29
201215928.70
20131,03010.52
2014377-17.3-1
20151528.91
Total3,0096.312

Some takeaways: First, Trumbo has only played two seasons in which he's seen more than 377 innings at first base. And in those seasons (2011 and 2013), he graded well in both metrics. Also, his only negative defensive season came in 2014, after he took over for Paul Goldschmidt, who broke his hand in August and missed the rest of the season. Earlier in 2014, Trumbo missed about two months due to a stress fracture in his left foot. He also battled plantar fasciitis.

It's worth noting that after 2011, arguably Trumbo's best defensive season, the Angels explored moving him to third base. (He healed after dealing with a stress fracture in his right foot.) The Angels also signed some guy named Albert Pujols, which explains why Trumbo barely played at first in 2012. He started eight games at third base that season (and wasn't very good) while mostly playing in the outfield. Pujols then missed a chunk of the 2013 season, and that was the last time Trumbo had regular work at first base.

Looking at individual defensive seasons can be misleading and is hardly definitive. Still, Trumbo's overall defense at first base seems solid. That is, unless you place heavy weight on FanGraphs' Inside Edge fielding data. That data, which goes back to 2012 and breaks plays down into six categories of varying difficulty, does not paint Trumbo's first base defense in the best light.

From 2012-2015, among 40 first basemen who have seen more than 1,500 innings at first base, here's how Trumbo ranks in the various categories:

Almost Certain/Certain (90-100%): t-22nd (97.6%)
Likely (60-90%): 40th (60%)
About Even (40-60%): 31st (45.5%)
Unlikely (10-40%): t-37th (0%)
Remote (1-10%): t-25th (0%)
Impossible (0%): All at 0%

So that's not great! Trumbo makes the plays right at him decently enough, but he's not skilled at pulling off difficult ones. But that doesn't mean he still can't make good plays. Here's one, from 2013:


And here's another:


Trumbo is big and strong, and he sometimes makes pretty good plays. He won't often wow you. And you can say the same thing about Chris Davis, who occasionally looks solid at first base but does not impress in the two advanced defensive numbers many analysts trust the most. Trumbo has graded well in those metrics, though it's been a few seasons since he played first base regularly. It will be interesting to see what happens if he does in 2016.

What the Orioles care about most with Trumbo is how well he hits. But if he ends up being the main option at first base, it wouldn't hurt to have an above average defender there.

21 November 2014

Can We Trust Lough's Defense?


Before David Lough went on his hot offensive streak in the middle of last season, Jon made the argument that Lough is actually a starter in disguise due to his excellent defense. He noted that Lough’s defense has been consistent for each season and projects to make him nearly a 2 WAR player over a full season. Pat suggested yesterday that an outfield consisting primarily of Adam Jones, Steve Pearce, Alejandro De Aza, and Lough could be acceptable. Certainly understanding Lough's value would be helpful. The main question is whether or not one can believe that Lough's defense is as valuable as UZR suggests.

Jon also noted in his earlier article that Lough’s defense may have been consistent for each season but that he’s played a limited number of innings in the field. So I looked at all outfielders that played at least 500 innings in the outfield from 2012-2014, and saw some surprising players in the top 20 in total UZR. For example, Lough’s total UZR was good for 11th out of 193 outfielders despite ranking 117th in innings. Lorenzo Cain and Juan Lagares were in the top five in total UZR despite ranking 58th and 87th in innings. Craig Gentry ranked seventh despite playing 12 more innings than Lagares. Dyson ranked ninth playing only 113 more innings than Lagares. This trend continues for outfielders that played 500 or more innings in the outfield from 2010-2012. Gardner ranked #1 in UZR and 59th out of 183 in innings. Peter Bourjos ranked #2 in UZR and 70th in innings. If outfielders with a minimal amount of innings playing in the outfield (i.e small sample sizes) have some of the highest UZRs then is there a correlation between innings played on defense and UZR? If not, then it may not make sense to say that an outfielders defensive value will improve if he plays more innings.

In the same vein, it seems reasonable to presume that players with more plate appearances produce more runs than those with fewer plate appearances because teams are far more likely to demote a player that is struggling offensively than one that is not struggling offensively. In other words, there should be correlation between plate appearances and total offensive production.

It's possible to answer this question. For each player from 2002-2014, I downloaded the number of innings they played at each position, their UZR at each position, their total number of plate appearances, and their “batting” score as derived by Fangraphs. Fangraphs "batting" score attempts to quantify the value of an offensive player by determine the number of runs above average his offensive production was worth in a given season. Then, I did a correlation analysis between innings and UZR as well as between plate appearances and “batting”. If there is a relationship between innings and UZR then I would expect to see a moderate correlation between these variables and a similar correlation between those statistics and the correlation between plate appearance and “batting.” Here's a table with the results.


The results suggest that the average correlation between innings and UZR is about .077. Defense intensive positions such as second base, third base, shortstop, and center field have larger albeit still low correlations than those for positions like first base, left field, and right field. The results for the correlation between PAs and "batting" tell a different story.


The average correlation between PAs and “batting” was .376. The largest correlations were at offensive positions such as first base, left field, and right field while there was practically no correlation at shortstop. It should come as no surprise that teams don't give shortstops playing time based on their ability to hit.

These results suggest that there is correlation between offensive production and plate appearances but not between UZR and innings played in the field and therefore it doesn’t make sense to give a player credit for a high defensive score that occurs in only part of a season. This explains why outfielders  that only play a limited number of innings consistently have some of the highest UZRs.

There is another possible way to interpret these results. These results could mean that managers don’t value UZR highly while valuing offensive production. If this is the case then there should be a similar correlation between innings and the absolute value of UZR as well as plate appearances and the absolute value of the “batting” statistic.

The average correlation between innings and the absolute value of UZR is .65 while the average correlation between plate appearances and the absolute value of “batting” is .52. This suggests that there is a moderate to high correlation between innings and UZR. It’s just that players that play a lot of innings at a position have a high absolute value that is either positive or negative. In other words, managers care less about whether their players have a low UZR than they do about whether their player is producing offensively. If UZR does measure defense accurately then this suggests that managers don’t value defense as highly as offense especially at offense-oriented positions.

This test is inconclusive in determining whether one should feel comfortable projecting Lough to be an excellent defender based on his UZR and performance in a limited sample. This should make us pause before overly valuing a limited period of good defense. Indeed, players like Nyjer Morgan, Ryan Sweeney, Andrew Torres, Tony Gwynn Jr., Gerardo Parra, and Ben Revere are all guys that put up strong defensive numbers in a limited amount of innings and then came crashing back to earth, and Lough could follow the same path.

This suggests one of two things. Either teams have better defensive metrics than UZR and therefore don't give its ratings high credence or that teams simply value offense more than defense especially for corner outfielders. This second scenario is probably bad news for outfielders like Jason Heyward. If UZR isn't a good defensive metric then it's likely that Lough's value is highly exaggerated. If UZR is a good defensive metric then finding a corner outfielder with good defense is an easy and undervalued way to improve. If so then even if the Orioles don't trust Lough's defense they should consider finding a proven player with similar strengths.

Photo via Keith Allison

26 September 2014

Highlighting Jon Shepherd's Best Work at Camden Depot

Camden Depot has become one of the go-to destinations to read in-depth discussion and analysis of the Baltimore Orioles. Obviously my view isn't objective, but I don't think anyone would say that's hyperbole. And all of the credit for crafting Camden Depot goes to Jon Shepherd, who founded the site in 2007. In that time, he published more than 700 articles (and plenty of others elsewhere), cultivating the readership into what it is today.

As Jon wrote a few days ago, he's leaving the site to work as a statistical analyst for Baseball Prospectus. So I thought it would be a good idea to provide links to some of his best work, both analyzing Orioles' topics and baseball in general.
So congratulate Jon (unless you really don't want to, which is cool) and enjoy looking back at some of his excellent research and analysis.

03 April 2014

Is Defense Overrated?


Fangraphs recently released some Inside Edge fielding data to the public. As stated in the article, Inside Edge scouts watch every play and determine how difficult it is to field on the following scale:

  • Impossible (0%)
  • Remote (1-10%)
  • Unlikely (10-40%)
  • About Even (40-60%)
  • Likely (60-90%)
  • Almost Certain / Certain (90-100%)

Unlike zone-based applications like DRS and UZR, Inside Edge defensive system results are determined primarily by scouts. This data gives insight to how scouts grade defense and determine similarities and differences between zone-based and scout-based systems.  

The Inside Edge fielding data available to the public states how many chances and the success rate for each fielder in every category listed above. For example in 2013, Nick Markakis had 112 impossible chances of which he converted zero, five remote chances of which he converted zero, five unlikely chances of which he converted two, six about even chances of which he converted all six, eighteen likely chances of which he converted fifteen and 289 almost certain chances of which he converted 288.
I used this data to create a metric I think of as Catches over Average (COA). It is derived by downloading all Inside Edge fielding data for each position and determining the average success rate for each of the six categories described above. Next subtract the average conversion rates for each category from the players performance and multiply by the number of chances. Finally, sum the results for each category. Many concepts incorporated in this metric were originally discussed here.

This metric has a number of shortcomings. It presumes that each chance in a category is of equal difficulty. It doesn’t measure how successful an infielder is at turning a double play. It doesn’t measure how successful an outfielder is at ensuring singles don’t turn into doubles or outfielder arm strength. Nor does it measure how well a catcher frames pitches or prevents passed balls or throws out potential base stealers. Inside Edge collects this data but doesn’t share it with the public. Despite these shortcomings this metric still can be used to compare Inside Edge fielding data results to UZR and DRS.

This table shows how some of the Orioles main players performed defensively in 2012 and 2013.


There are many similarities between COA and UZR or DRS. Matt Wieters, Manny Machado and JJ Hardy are considered excellent defenders while Ryan Flaherty and Chris Davis are considered above average. Each indicates that Mark Reynolds and Wilson Betemit are unable to play third base very well while Adam Jones is a poor defender in center field. The main difference is that Nick Markakis is a good defender according to COA and a bad one according to UZR or DRS.

In 2012, our outfield defense ranked 16th in the majors with a -1.73 COA while our infield defense ranked 7th with a 9.13 COA. In 2013, our outfield defense ranked 26th in the majors with a -2.40 COA while our infield defense ranked 2nd with a 30.9 COA. Having a full season of Manny Machado at third base instead of using Wilson Betemit and Mark Reynolds had a significant impact on our infield defense. This statistic indicates that the Orioles have excellent infield defense and mediocre outfield defense which is the common consensus.

The difference between the best and worst infield defense was 48 COA in 2012 and 52 COA in 2013 while the difference between the best and worst outfield defense was 30.5 COA in 2012 and 20 COA in 2013. These numbers seem low when compared to UZR especially when one considers that a catch doesn’t equal a run. In order to do a full comparison it is necessary to determine how many catches equal a run.

Tom Tango states that each catch is worth .8 runs. This implies that the amount of runs saved can be determined by multiplying the value of a catch by a players COA. I’ll refer to this stat as Defensive Runs over Average or DROA. *

 It was brought to my attention that Tom Tango has discussed the value of saving a play. Originally, I quoted Michael Lichtman who stated that a typical outfield hit is worth .83 runs and simply estimated the value of an infield hit. I believe that estimate was incorrect.  

It is possible to compare DROA to UZR. The table below shows the ranges for UZR and COA for each position.

Position COA Range Value Of Catch DROA Range UZR Range UZR/DROA Range
1B 16.56 0.80 13.25 30.90 2.33
2B 25.94 0.80 20.75 31.70 1.52
3B 26.01 0.80 20.80 48.00 2.31
SS 25.22 0.80 20.18 45.20 2.24
CF 14.60 0.80 11.68 42.50 3.64
LF 12.15 0.80 9.72 31.30 3.22
RF 13.31 0.80 10.65 47.10 4.42

The range for UZR is about 2.25 times larger than DROA for infielders (except second base) and 3.75 times larger than DROA for outfielders. Instead of a top defender like Machado being worth 3 wins defensively this stat indicates that he’s worth one win. This implies that defense is less valuable than one may have thought based on UZR. **

** Due to the new data, I've updated the ranges quoted above.

The good folks at Retrosheet attempt to document every baseball game played. They share their data with the public provided that the following disclaimer is used:

Information used here was obtained free of charge from and is copyrighted by Retrosheet. Interested parties may contact Retrosheet at www.retrosheet.org

I downloaded the data from the 2012 and 2013 seasons from their site and determined how many balls in play allowed by each team. I split the balls in play into outs and non-outs (including hits and bases reached on error). Then I did the same thing with the Inside Edge Data. Below are the results.


The numbers of outs for balls in play are different in each dataset by a minimal amount while there are more than twice as many balls in play in the Retrosheet dataset for each team than in the Inside Edge dataset. The average team had a BABIP of .298 using the Retrosheet data and a .188 using the Inside Edge data. The Inside Edge data is omitting a large number of hits.

UZR and DRS split up the whole field into zones. Each ball in play has to fall into a zone which is the responsibility of at least one but potentially more fielders. If a ball isn’t caught then it is someone’s fault and it impacts their UZR/DRS rating. The Inside Edge data seems to indicate that part of the field is no fielders’ responsibility. Other parts of the field may be a fielders’ responsibility but an uncaught ball hit there has no impact on his defensive rating if it’s considered an impossible chance like most non-out balls in play. Balls hit into play that do have an impact of a fielders rating are usually ones that every fielder can field with nearly perfect accuracy. As a result, there is less variation in defensive ratings and an elite player according to UZR may be worth 3 wins defensively while an elite player according to DROA is worth 1 win defensively.

It is possible to determine whether UZR or COA is more likely to predict future performance by doing a correlation analysis. I found that UZR had a correlation of .393 from 2012 and 2013 while COA had a correlation of only .249. This suggests that UZR is more likely to predict future performance though neither is particularly accurate. I also found that while range runs above average is the best factor to predict UZR that error runs above average is the best factor to predict COA which supports the above paragraph. This explains why players similar to Nick Markakis that have limited range but make few errors have much higher defensive ratings using Inside Edge data rather than UZR while players like David Lough that have excellent range but make errors have much higher defensive ratings based on UZR rather than Inside Edge.

The average AL team allowed 696 runs in 2013. According to UZR, the Royals defense (best in the AL) was worth 68 runs. This means that a team with average pitchers and the Royals defense would have allowed the fourth fewest runs in the American League. Using DROA, the Orioles defense (best in the AL) was worth 16 runs. A team with average pitchers and the Orioles defense would have given up the ninth largest amount of runs or still been about average. The amount of importance that UZR places on defense as opposed to Inside Edge is huge.

If UZR is correct in its rating of defense then focusing on defense should be a cost-effective way to improve performance. If Inside Edge is correct then excellent defense players offer smaller contributions than UZR and WAR would suggest. I believe that the Inside Edge data suggests that defense is overrated.

17 December 2012

The Aging of Bad Outfield Arms

A few weeks back, I took a look at how elite arms age in the outfield.  What was interesting in that little study was that performance peaked in year two and then collapsed.  There was some question as to whether it was merely a regression to the mean sort of phenomenom (although if that was the case the trend should be flat instead of a concentrated and significant increase in year 2).  There was some interest in how poor outfield arms aged and whether it looked like a mirror image of the good arms or if bad arms gain a reputation and will be exploited by runners.

If you did not click on the link above, here is what the elite arm graph looked like.


I used the same methodology of the previous post, but used the nine worst outfield arms as defined by Defensive Runs Saved.


Runs by Arm per 1400 Innings


1 2 3 4 5
Andre Either -9.0 -3.6 -5.1 -6.1 -2.6
Coco Crisp -3.8 -4.4 -3.1 -1.2 -6.3
Chris Young -2.2 -6.0 -6.9 3.1 -3.1
Justin Upton 1.6 -1.2 -6.3 -5.1 -3.3
Ryan Braun 1.1 -2.1 -4.2 -6.7 -1.1
Corey Hart -6.4 -3.1 -3.0 -1.2 -5.2
Jason Bay -2.9 -9.0 -8.2 -2.3 -4.2
Grady Sizemore 0.0 -3.0 -4.0 -2.1 -8.7
Matt Holiday -9.2 -4.0 -5.2 -1.0 -2.3
This yields an insignifiant p value (0.39) and the following averages and standard deviations:


1 2 3 4 5
Average -3.4 -4.0 -5.1 -2.5 -4.1
StDev 4.1 2.3 1.7 3.1 2.3
What does that all mean? 

I am not sure what this means with respect to this population or the statistically significant differences observed in the elite arms group.  No trends can be measured here or inferred.  Bad arms do not seem to improve as a group and neither are they exploited.  The explanation eludes me.  It may well be that the elite arms group was genuinely a unique occurrence.


23 November 2012

The Camden Highball (Episode 5): Men who Stare at Men with Gloves

Oh, it is a Thanksgiving miracle!  The long awaited to be edited fifth episode of the Camden Highball is ready for public consumption.  Joining me on the show is Andrew Gibson of Baseball Info Solutions and Camden Chat fame.  We are discussing quite a bit about defensive metrics: what they mean and how they are calculated (in a very general idea-based way).  This means that we discussed the Orioles outfield and the worthiness of their gold gloves as well as one of our favorite subjects here at the Depot, Mark Reynolds.  Kevin sent me an email for me to comment on the Trayvon Robinson and Robert Andino deal that we wrote about earlier.  Let's get started...

Episode 5 of the Camden Highball

00:00:00 Music - Baltimore is the New Brooklyn by J.C. Brooks and the Uptown Sound (in full at end of podcast)
00:00:25 Greetings from Jon
00:02:00 Mailbag from Kevin in Newport News, VA.  Should we be excited about Trayvon Robinson?  What this means for Xavier Avery?
00:09:32 Interview with Andrew Gibson
00:10:25 What are DRS and UZR?
00:12:37 Balls hitting the outfield fence in DRS
00:15:08 Differences between home/road splits for Camden Yards
00:21:10 Good fielding plays explained using Mark Reynolds
00:25:49 Breaking down the arm component using Davis, Jones, and Markakis
00:40:12 Off season perspective on first base, More Mark Reynolds and others
00:45:55 Andrew likes Youk
00:48:04 Jon wonders about Travis Ishikawa and first base defense
00:52:02 Orioles needing to keep window open without selling off future
01:00:39 Baltimore is the New Brooklyn (in full)

We are available on iTunes (though we still seem to have some problems with updating there).  If you have any question you would like to pose to us, feel free to mail them via CamdenDepot@gmail.com or via the Camden Depot Facebook page.

Articles of note mentioned:
Depot's Home/Road UZR Split Post (it was nice to see this article had legs)
Dewan's indirect response on Jones and Markakis
Depot's pilot study on how arm components of defensive metrics change for elite arms

06 November 2012

Nick Markakis and the Decreasing Impact of His Arm

Nick Markakis is a subject of much discussion.  Early in his career, he was lauded by scout and statistician alike for his defensive abilities.  Over time, a growing current of dissent has emerged questioning his ability in the field.  On the last podcast, Daniel and I were discussing Markakis' arm among other things.  Looking at pure numbers, Markakis threw out quite a few base runners throughout his career until this season when he killed only three runners in 926 innings.  It was a far cry from his 2008 high of 17, but has also killed 13, 14, and 14.  Defensive metrics suggest a different story with one exceptional year in 2008 and the rest rather pedestrian.  It made me wonder if defensive metrics, like counting stats tell an incomplete story.

Arm ratings in defensive metrics look at three things: holding runners, assists, and kills.  It stands to reason that the runs saved attributed to an outfielder would be greater for killing the runner as opposed to being an accomplice.  Being an accomplice to the out would then be more valuable than holding a runner.  A concern on how well runs saved represent the talent in a player's ability to throw a ball is whether or not he has the opportunity to show off that talent.  In other words, if base runners fear an outfielder's arm then the outfielder will be given fewer opportunities to wipe the runners off the base paths as a function of the runner's hesitancy to test the arm.  However, based on my conversations with baseball folk and through my own work on assessing how a pitcher's fastball velocity changes as he ages, arm strength should be relatively consistent through the majority of a player's starting career.  If the metrics trying to represent the value of a player's arm actually coincide with how talented that play is in throwing the ball, then you would expect a flat line.  Arm value should remain constant as a player ages if his arm quality remains the same.

In this post, I wanted to look at something simple.  A measure of talent is typically a good measure of talent if the measure is consistent.  That if you have an 80 arm in year 1 resulting in 20 runs saved, then, if the metric is strongly related to talent, in year two the 80 arm should result in another 20 runs saved.  I decided to take an elite group of arms and observe how their runs saved attributed to their throwing changes from year to year.  Now, this is a simple study with a population of only ten, but it may serve as a decent launching pad for further discussion.

The list below are the top ten cumulative arms using rARM (DRS methodology) from 2005-2012 using their first five seasons and by defining their first season as the first year they achieve 900 innings in the outfield.  Both Adam Jones and Nick Markakis are in this grouping.

rARM - DRS

Year


1 2 3 4 5
Jeff Francouer 3 10 2 4 8
Shane Victorino 4 5 3 -1 3
Adam Jones 5 10 5 8 -1
Alex Rios 7 4 8 7 8
Alfonso Soriano 7 14 4 1 -4
Hunter Pence 0 8 6 -1 5
Jayson Werth 3 3 5 3 -1
Melky Cabrera 3 9 1 0 4
Nick Markakis 2 2 10 2 0
Matt Kemp 8 7 -4 4 4
Here is the same list, but with the ARM metric from the UZR methodology.

ARM - UZR

Year


1 2 3 4 5
Jeff Francouer 3.5 16.6 2.5 5.3 9.7
Shane Victorino 5.3 3.9 3.0 -1.0 2.2
Adam Jones 3.3 6.6 2.5 5.4 1.7
Alex Rios 11.7 6.5 5.6 6.0 5.6
Alfonso Soriano 4.9 14.3 4.8 -3.5 0.5
Hunter Pence -0.1 8.2 6.6 -1.0 3.5
Jayson Werth 4.2 4.4 3.3 5.4 -1.4
Melky Cabrera 3.4 4.4 1.1 -3.9 3.0
Nick Markakis 1.1 2.7 6.7 0.9 1.1
Matt Kemp 8.0 4.3 -6.1 4.0 3.4
I took the sum of both the rARM and ARM metrics by year as well as those metrics normalized to what would be expected over 1400 innings.  What I mean normalized or adjusted values would be the following: if player A saved 10 runs over 1000 innings then he would be projected to save 14 runs over 1400 innings.  Whether right or wrong, I did this to cut down the variation in the numbers above by changing the counts into rates.  If there is an issue with doing this, then I am sure someone will be kind enough to inform me.


The difference between the cumulative runs saved looks significant.  I decided to run an ANOVA on the adjusted Runs Saved for the population (not cumulative), which resulted in significant p values for both DRS (p=0.04) and UZR (p=0.01).  Further analysis of both metrics indicated that year 2 performance was significantly greater than years 3-5.  This is illustrated below.

I am uncertain what exactly this means, if anything.  One could construct a nifty narrative about how it takes a fielder a year to learn his position to perfect his performance and then perhaps an additional year for the league to respect him.  This would account for the population to increase in their performance and then have the value associated with the arm decrease as opportunities to kill the runner decrease due to the runners holding.  As mentioned earlier, fielders are credited for holding a runner, but not to the same degree if they are able to eliminate the runner from the base paths.  It should be noted that this is less of a conclusion and more of a hypothesis based on this observation.  I do not know if what we see in the graph above would be repeatable with a more robust dataset or if there is a better hypothesis to explain this observation.

The alternative hypothesis would be playing into the early defensive peak.  It may be that around what normally would be the second year of a player having a starting job.  The narrative here would be that a player's ability peaks early in his career and then tails off.  That certainly is the case with range and it may well be that the opportunity to kill a runner has as much to do with a player's arm as it does with a player's range.  It may be that by not being able to put himself in a position to get to a ball quickly that the fielder is simply reducing the number of chances he has to impact base runners.  Additionally, it may be that ability in range or route running may decrease, resulting in the player putting himself in worse position for a throw.  That would be a situation that likely would have more affect on accuracy than arm strength.

Simply put, I have questions.  Perhaps, as my post on UZR in the Camden Yards outfield led to a great deal of words being hashed out, including by John Dewan in his Fielding Bible, maybe this post will also launch a thousand blogs just the same.