Showing posts with label Pitching. Show all posts

23 August 2017

How Pitch Sequencing Can Affect Outcomes

The 2017 Baltimore Orioles starting rotation has been a bit of a mess. Maybe with some data and some advance planning, the starting pitchers can become more effective. If we can identify the two-pitch sequences to end plate attempts and compare outcomes to those sequences, we may find that some pitches work well together, with one setting up the next. This can be considered a proof of concept; the same sequencing can be extended to sequences of three and four pitches for more granularity (at the expense of sample sizes).

To put together these sequences, I first needed pitch-by-pitch data. PitchFX is great for that, if you can get your hands on it. I set up a database of PitchFX records from 2015 to today (and counting!) using the MLBAM Gameday records stored in XML for what seems like perpetuity. From there, finding pitches that end plate attempts is fairly straightforward, as is finding the pitch that preceded it. Because my database only goes back two and a half seasons, data is a little limited, especially for the youngest members of the Orioles rotation.

Consider Dylan Bundy, whose slider is identified as a high-quality pitch by BrooksBaseball.net, noting its high swing-and-miss rate. Fangraphs gives Bundy's slider a much higher value rating than any of his other pitches (his next highest rated pitch per Fangraphs' weighted values is his Changeup). Bundy's slider appears most effective when paired with his four-seam fastball given the triple-slash outcomes of pitch sequences involving a slider (and that end within one pitch of a slider being thrown):
Limited to the 10 most frequent two-pitch combinations to end plate attempts
Bundy has used a four-seam and slider combo nearly 50 times in some order, and the results have been great. Batters are hitting 0.100 off of either pitch when paired with the other. The SL-FF combination produces a slightly higher on-base percentage, which leads me to believe that the fastball is occasionally thrown after the slider goes for a ball and results in some walks.

However, Bundy's slider isn't entirely unhittable. When he goes back-to-back with sliders and the second one ends a plate attempt, they're getting hit well. Batters are slashing roughly .350/.400/.400 when putting a second consecutive slider in play. While this doesn't account for all the times a SL-SL sequence did not result in the plate appearance being terminated, it definitely looks like Bundy should be cautious to throw his slider multiple times in a row - which makes sense, and isn't unique to Dylan Bundy. A batter is expected to get better at identifying a pitch and tracking its movement the more often he sees it.

Kevin Gausman likes to throw heat - and he's good at it. But with sequencing in mind, Gausman might find that the pitch he throws most isn't his best pitch, and that his most frequent pitch sequence isn't doing him any favors. Gausman throws four-seam fastballs over 60% of the time, but they tend to get hit well when batters see them back-to-back. Gausman's split-finger fastball, however, is frequently involved in positive outcomes.

The FS-FS sequence to end a plate attempt has yielded a .180/.260/.270 slash line since the beginning of the 2015 season, and a FF-FS or FS-FF sequence has resulted in a lower batting average and on-base percentage than the more common FF-FF sequence. If Gausman wants to throw hard, and it looks like he does, the pitching staff should encourage him to mix more split-finger fastballs to the mix.

Gausman's full stats show that he throws the FF-FF combination significantly more often than any other pitch sequence, which we should expect given how frequently he throws the four-seam fastball. The positive outcomes on a FS-FS combination come on just 65 instances of that sequence ending a plate attempt, and may be subject to a small sample size. That number of plate attempts is far fewer than the point at which most pitching statistics stabilize. Since the outcomes are so positive, it probably wouldn't hurt for Gausman to test throwing FS-FS sequences more frequently, or just to throw his split-finger fastball instead of his four-seam fastball in some instances.

This type of sequencing can be extended to more pitches to map the value of mixing pitches within a plate attempt, or it can be used to find two-pitch sequences throughout plate attempts that don't result in outcomes. For instance, Gausman's FF-FF sequence might not have the best outcomes when a batter connects with the pitch, but it might coerce more swings and misses or swings outside the zone during an at bat. At the very least, it's helpful for pitchers, catchers, and coaches to understand the value and risk in throwing specific pitches back to back.
25 January 2017

Pitchers with the Most Effective Curveballs

I sought to generate a new means of pitch evaluation that uses exit velocity, as new research by some of the smartest people around baseball suggests that exit velocity (along with launch angle) is one of the best indicators of whether a batted ball will become a hit.

To generate this new means of measuring pitch effectiveness, I first broke the data into matchup types according to pitcher and batter handedness. Within each matchup type, I found each batter's average exit velocity against curveballs. Then, I compared the exit velocities of unique pitch events to the batter involved in the event's average exit velocity. Finally, I averaged the difference between observed and average exit velocities for each pitcher. This generates a record of each pitcher's average suppression or amplification of a batter's overall ability to hit curveballs hard.

Because this method of pitch evaluation is based on individual batters' average exit velocity, it implicitly accounts for the primary driver of exit velocity: bat speed. Additionally, because the data is split along handedness matchups, it accounts for platoon advantages.

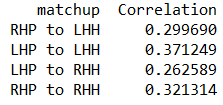
In 2016 data, there is a direct correlation between a pitcher's mean difference between the exit velocities on curveballs he surrenders and a batter's average exit velocity on curveballs and the measured exit velocity of a unique curveball for each combination of pitcher and batter handedness. The data shows exactly what is expected: pitchers whose curveballs are, on average, hit harder than other pitchers' tend to see a higher exit velocity on specific curveballs. Put another way, if a pitcher's curveballs are all bad, it's more likely that a specific curveball he threw is bad.

The correlation between average exit velocity suppression and observed exit velocity is noticeably stronger in matchups between pitchers and batters of the same handedness:
Right handed pitchers with bad curveballs get hit even harder by right-handed batters than left-handed batters, but good curveballs against same-handed batters suppress exit velocities more than they do against opposite-handed batters.

Records for Orioles pitchers, shown below as white-outlined, non-transparent points, show only Dylan Bundy displaying an ability to suppress a batter's average curveball exit velocity, and he effectively suppresses exit velocity against both right-handed hitters and left-handed hitters. Other Orioles pitchers tend to throw curveballs hit roughly 5 miles per hour harder than the batter they're facing hits curveballs.

Yovani Gallardo, recently shipped to Seattle, threw a curveball that was hit over 3 miles per hour harder by righties and 6 miles per hour harder by lefties. Dylan Bundy and Tyler Wilson throw curveballs with an apparent ability to suppress the exit velocities of left-handed hitters.
That Dylan Bundy shows up here as having a pretty good curveball is supported by Brooks Baseball's general assessment of his pitch:
His curve is a real worm killer that generates an extreme number of groundballs compared to other pitchers' curves and has a sharp downward bite.
Per Fangraphs, Bundy's curveball was his most valuable pitch in 2016, with the pitch worth about 1.1 runs above average in 2016. Bundy's fastball, by comparison, was worth -4.7 runs below average. While the above analysis does not take game scenario into account, Fangraphs' pitch values do, but incorporating run expectancy based on count.

That this method of measuring pitch effectiveness is in agreement with longer-standing methods suggests that using a pitcher's mean exit velocity suppression on any pitch type can in fact give an estimation of quality of the pitch. However, this method does not take into account a pitcher's ability to induce swinging strikes, ability to throw curveballs with consistent command, game situation, or pitch sequencing. There is certainly a long way to go - for most pitch value or effectiveness measures - to incorporate all aspects of the game that affect a single pitch in a single at bat.

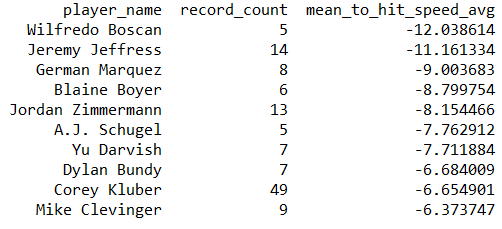
The top ten right-handed pitchers (minimum 5 records) by ability to suppress right-handed batters' exit velocity against curveballs are:
The top ten right-handed pitchers (minimum 5 records) by ability to suppress left-handed batters' exit velocity against curveballs are:

***
Pitcher Mean Difference from Batter Mean Exit Velocity by matchup:

Thanks to Camden Depot owner Jon Shepard for his contributions to defining the problem addressed in this article.

23 December 2015

Don't Worry About Chris Tillman's K-BB% Decline

Chris Tillman is the icing on the cake of the Erik Bedard-Adam Jones swap of 2008. If the team had gotten only Jones, the trade would’ve been a win. He has become the face of the franchise during the Orioles’ return from exile in baseball’s hinterlands. But Tillman has provided good value also. Although he struggled from 2009-2011, he pitched well from 2012-2014, breaking out alongside Jones, Manny Machado, Chris Davis, and others.

2015 was his worst full season yet. Hidden within the high ERA was the fact that the season concluded a three-year stretch where his K-BB% dropped each year, even when accounting for changes in league K and BB rates.

Here are his K-BB rates relative to the league, where 100 is average and higher is better:

  • 2013: 114
  • 2014: 78
  • 2015: 61

This drop alarmed me. Strikeout and walk rates are among the most relevant predictors of a pitcher’s future success (in terms of run prevention). Accordingly, I wanted to understand whether this drop portended doom for the 6’5”, 210-pound righthander.

To check, I gathered all pitchers since 1955-2010 who met the following criteria:

  • Starting at age 24, 25, or 26, experienced two consecutive year-over-year declines, relative to the league each year, in K-BB rate
  • Did not miss a season in this three-year window.
  • Pitched at least 150 innings each year.

120 pitchers met these criteria, 1.3% of pitchers in the 8,944-person sample. The names range from all-time greats to scrubs you’ve never heard of. For all 120 pitchers, I then looked up the following information:

  • Their average number of innings pitched each season for the three seasons following the decline
  • Their ERA- in these seasons.

In this study, the first metric is the best one to indicate how much value the Orioles might get out of Tillman in the next three years. A high innings total means a pitcher is both healthy and good. A low innings total would indicate the opposite, with the possibility that a starter got moved to the bullpen. The length of time is relevant because the Orioles control Tillman for the next three years as they go through salary arbitration.

We can look at this set of results in a variety of ways.

Largest and Smallest Three-Year Declines

The largest three-year K-BB decline happened to Mario Soto from 1982-1984. In those years his K-BB rate declined a whopping 248%. In the three years following his decline, he was demonstrably worse than league average, although not a bad pitcher, pitching 130 IP/year with an ERA- of 112.

The smallest decline happened to two pitchers: Mike Pelfrey from 2008-2010 and Jim Bouton from 1963-1965. Each declined by 9% relative to the league. Pelfrey, who recently signed with the Tigers, averaged 121 IP/year in the three years following his decline, even though his ERA- was a respectable 106. The reason for his low innings total was that Tommy John surgery that cost him most of the 2012 season. His K-BB total actually declined one more year in 2011.

Bouton averaged just 69 IP/year in the three years following his decline with an ERA- of 119. Okay, but not good. The first year after his decline was his last year as a starter; the next two years he was a reliever/spot-starter. (It must be said that in the fourth year after this decline, he signed with the expansion Seattle Pilots and wrote a famous book about the experience.)

Best and Worst Post-Decline Phases

When I say "best" here, I mean "highest average IP/year for the three seasons following the decline". As I said above, a high IP total is an indication the pitcher is performing well. The reason he's doing so is not important for this study.

The best post-decline phase has to be that of Jim Palmer. Yes, Tillman can take solace in the fact that the man who calls half his games also experienced a significant decline in K-BB rate. From 1972-1974 Palmer’s K-BB rate fell by an ugly 107%, finishing at a low of 1.9% in 1974. That wouldn’t play today, but in the mid-70’s that was okay, and Palmer was still getting outs. He continued to do so for the next three years, averaging a whopping 319 IP/year with an excellent ERA- of 70.

Another famous name comes in second place on this list. Steve Carlton’s relative K-BB rate declined 78% from 1969-1971. That didn’t hurt his career any, as over the next three years he averaged 310 IP/year  with an ERA- of 81.


The worst post-decline "career" is undoubtedly that of Noah Lowry, who declined 135% from 2005-2007 and didn't pitch at all after that. The thing is, he was a very good pitcher in 2007, putting up an ERA- of 88. He just suffered a string of injuries that forced him out of the game. Down in the cellar with him is Ricky Romero, whose K-BB rate declined 88% from 2010-2012 and who's thrown just 7.1 major league innings since.

Does K-BB% Decline Explain Variation in Post-Decline IP?
In addition to Palmer and Carlton, several other Hall of Famers show up on this list. Nolan Ryan, Don Drysdale, Dennis Eckersley, Sandy Koufax, Bert Blyleven, and Tom Glavine are all there. Other names you’d recognize are Orel Hersheiser, Dave Stieb, Dwight Gooden, Jon Lester, Andy Pettitte, James Shields, Kevin Brown, Josh Beckett, Carlos Zambrano, Tommy John, Tim Hudson, Cole Hamels, and Max Scherzer.

The presence of such names shows that you can be a good pitcher, even a great one, while experiencing a declining core skillset at a young age. A scatterplot shows conclusively that the magnitude of a pitcher’s K-BB rate decline explains none of the variance in how many innings he will average during the following three years:


Soto, way out by himself on the right side of the graph, probably skews the results, as does the man to his left (Mike Norris with a 203% decline from 1980-1982). If we examine pitchers whose K-BB rate declined between 43 and 63%, a range that places Tillman in the middle, do we get a different picture?


Nope. The relationship is just as non-existent even when looking at Tillman’s direct comparables.
These graphs show that K-BB rate declines happen to Hall-of-Famers, middle-tier innings-eaters, and scrubs alike. If you need further proof, here’s a histogram of post-decline ERA-:
50% of these pitchers have an ERA- of 103 or lower, with the average being 111. The Orioles would take this kind of performance from Tillman; it would certainly beat his 2015 ERA- of 121.

There is probably some survivor bias going on here. If you’re good enough to pitch 150 innings/year for three years starting at age 24, 25, or 26, you’re good enough to compensate for a K-BB rate decline. That, or perhaps strikeouts were never a big part of your game to begin with. Or you pitch to contact enough to limit the damage from walks. Or you're young enough that some team will give you a chance.

Tillman has shown some evidence of adjusting; as his K-BB rate has declined, he’s become more of a ground-ball pitcher in an effort to limit the damage:


This adjustment doesn’t mean that Tillman will be okay, but that indicators of his decline will have to come from somewhere else. The fact that his K-BB rate has declined means nothing for what the Orioles should expect out of him through 2018. Plenty of major-league pitchers have experienced what Tillman is going through and have been just fine. 

You can view the full list of K-BB decliners here.

All data for this post courtesy of FanGraphs.

17 September 2015

Velocity Lost: Mike Wright's September Fastball


As the season began, we knew that it would be the final seasons for Wei-Yin Chen and Bud Norris in an Orioles uniform.  Ultimately, their departure would resolve the issue of having six starting pitchers, but would introduce the need for a fifth starter.  That fifth starter conversation began with internal candidates, such as Zach Davies, Dylan Bundy, and Mike Wright.  Davies was dealt at the deadline for an over-his-head Gerardo Parra.  Bundy suffered elephant arm or something, which resulted in another period of downtime for the long heralded prospect.  Wright has remained somewhat healthy and has been a general disappointment.

To those who follow the Major League club, Mike Wright was a non-entity before the season.  To those who read prospect rankings, he was a deep second tier prospect who profiled as a backend arm or, perhaps, as a middle reliever.  Where Davies had several average pitches and control, Wright had a fastball that occasionally came in loud and not much else.  Control and acceptable secondary pitches eluded him.  Spring training changed that.

In the wake of the ludicrous stories of the second arrival of Branden Kline, a rumble was heard from scouts about Mike Wright.  It was communicated to me that Wright was impressing opposing scouts immensely during his outings.  I was told that his fastball no longer sat around 92, but had bumped up to 96 with some movement.  That increase in quality in turn helped his slider and changeup play even though they were not appreciably better pitches in a vacuum.  The consensus of a few people from different organizations was that he was not a top of the rotation pitcher, but he was now seen as a first division starter prospect.  Wright was someone who other teams would be highly interested in after being told no to Bundy or Hunter Harvey.

In May, injuries and poor performances brought Wright up to Baltimore and into the starting rotation.  His game plan appeared similar to what he was doing during Spring Training, come in hard with a four seam fastball nearly three quarters of the time.  Mix in a few sliders and changeups to keep hitters honest.  It did not work.  Wright's fastball lost three to four miles per hour.  That may not sound like a lot, but one mile per hour is worth about 0.25 to 0.30 in how many runs are scored off a pitcher.  If the pitcher is simply throwing the ball without much movement or mixing pitches effectively, then he can turn from a good pitcher to someone relegated to AAA.

After a few decent starts pounding the strike zone, Wright lost his luster and was hammered in June.  He tried to compensate for batters waiting on the fastball by throwing more changeups and sliders, but that did not resolve his troubles.  A .457 wOBA in June sent him back to Norfolk.  He would not return to Baltimore as a starter until September.  Wright was now someone who was perceived as more valuable to the Orioles than any other club.  Outside the organization, he was seen more or less as a meaningful secondary piece, not much more.  To the Orioles, he was someone who they were very reluctant to let go.

With September and its expanded roster, the Orioles sent for a healthy Mike Wright to close the year out with the club. 

     9-05 4 IP   5.90 FIP  95.9 FB
     9-11 5 IP   8.75 FIP  93.7 FB
     9-16 5 IP 12.15 FIP  93.0 FB

In three starts, Wright has seen things going from bad to worse.  Even as poor as that first start was, there was hope as he flashed the potential that people saw in the spring: a lively fastball.  However, that hope evaporated in his next started as his average fastball velocity not only dipped below 95 mph, but only topped that mark a handful of time.  Last night?  He did not record a single pitch at or above 95 mph.

Also interesting is that his pitch mix has also significantly changed from his previous starting venture with the Orioles.  In May, his mix was roughly 70% 4S / 15% SL / 15% CH.  This month, he has introduced a two seamer, so his mix is now 45% 4S / 25% 2S / 20% SL / 10% CH.  The new use of a two seamer is quite interesting as it is a seeming acknowledgement that perhaps his other pitches are not effective swing and miss pitches.  A two seamer would let him to some degree permit some contact. 

Additionally, as Wright has settled in with a slider, a two seamer is a more natural complementary fastball than a four seamer is.  The reason, I am told, is that an effective slider requires a lower arm slot than what would be most effective for a four seam fastball.  I have not gone in depth with Wright to determine what would be best for him and do not exactly trust myself at that level of mechanical detail.  Assuming all that is true, the introduction of a two seamer may well be showing the club's intention to transition him into a starting pitcher who does not solely rely on a blistering fastball.

That said, the club could always go backwards and raise the arm to generate more velocity if they decide to convert him into a reliever.  A high 90s fastball with a fringe changeup and a fringe slider will work once through a lineup.  For now though, it certainly seems like the club is planning to give Wright a shot at the rotation next Spring.  However, there is a lot of time between then and now.

23 September 2012

Sunday Comics: RELEASE THE CUTTER!

Hi, everyone - happy Sunday!

My name is Steph Diorio, and I write over at Charm City Yakyuu for Aerys Sports. I also draw way too many cartoons, and Jon's brought me on board officially as the Sunday cartoonist for Camden Depot! It's an honor to be writing and drawing here and I can't thank Jon enough. I hope my cartoons make your Sundays a little bit happier!

Today's edition is a little protest poster based around Dan Duquette's hatred of a certain pitch.


18 November 2011

Interview with an Arm Injury Researcher, Part II


 by Will Beaudoin
Will is a freelance writer who has written for Camden Depot previously.

Long Toss Mechanics (Picture from Dick Mills' site.)
During my discussion with Dr. Fleisig, I asked him for a few examples of compelling research in the field of biomechanics from the past year. Interestingly enough, he directed me towards two articles he had a hand in creaing—“Biomechanical Comparison of Baseball Pitching and Long-Toss: Implications for Training and Rehabilitation” (Fleisig, Bolt, et al, 2011; Ed. note: Camden Depot discussed this article briefly in a previous post) and “Risk of Serious Injury For Young Baseball Pitchers: A 10-Year Prospective Study” (Fleisig, Andrews, et al, 2011).

The first piece, concerning itself with the somewhat controversial training and rehabilitation practice known long-toss, Fleisig et al. (2011) set for the hypothesis that there are “kinetic…differences in the throwing shoulder and elbow” in long-toss when compared to pitching off a mound (p. 297). More than a dozen college-level pitchers were asked to long-toss from 37 meters, 55 meters, and from a “maximum distance”. For the 37 meter and 55 meter throws, the pitchers were required to throw with little to no arc, while no such restriction was placed on the “maximum distance” toss. Data from this session was collected using a motion capture device. On a separate occasion, the same pitchers were asked to throw their “standard” fastball from a mound, again whilst recorded by a motion capture device.

As Orioles fans, this is a study that should interest us considering the controversy surrounding Dylan Bundy’s own long-toss program around draft time and it’s potential long-term physical effects. While this particular study doesn’t provide any conclusive evidence in regard to long-term injury outlook, the study does show that both “shoulder and elbow torque increase with throwing distance” (p. 302). This leads the researchers to believe that long-toss, especially “maximum” distance long-toss may in fact be harmful to a pitcher—perhaps something to keep in mind when thinking about Bundy’s long-term health.

The article titled, “Risk of Serious Injury For Young Baseball Pitchers: a 10-Year Prospective Study”, focused on pitching injuries in young pitchers and seemingly dispels the widespread belief that youth pitchers shouldn’t throw breaking balls for fear of injury. A long-term study, the researchers monitored nearly 500 pitchers under the age of fourteen over a ten-year period. After hundreds and hundreds of interviews over the course of a decade, it was discovered that it wasn’t so much the pitch-type that led to injury, but rather the amount of pitches and innings thrown. Over the course of the study, Fleisig et al. discovered that pitchers who threw more than 100 innings in a single year “had about 3.5 times as much chance of serious injury as those who pitched less” while they couldn’t “determine whether pitchers who started throwing curveballs before age 13 years [had] a higher chance of injury” (p. 256). While not necessarily directly applicable to the major league level, research such as this only goes to show that so much of injury prevention lies within the rather simple philosophy of volume management.

I also had the chance to talk briefly with Will Carroll in regard to pitching injuries. Will, who got his start at Baseball Prospectus, now writes for Sports Illustrated, and has authored several books dealing with sports injuries, was kind enough to answer a couple of my questions.

A common theme when discussing pitching injuries on the Internet is the phrase “inverted w.”  Do you have any thoughts on the validity of inverted w's being dangerous to a pitcher's health?
I'm not a proponent of the Inverted W. Back when I was first learning about biomechanics, I talked to a lot of the top minds in the game and I felt like I knew enough to just look and see things. Well, as with umpires and the strike zone, sometimes our eyes lie. I want more than just observations - I want data. With biomechanics analysis, we can figure out how much stress a pitcher is actually putting on joints, how much force they're exerting, and then we need to move to fatigue and recovery. Few teams are doing the first part of this and fewer are doing the second. Should we wonder then why baseball has lost over a BILLION dollars to pitcher injuries in the last ten years? Moneyball talked about ASMI and their biomechanics lab, but you know how many teams use it now? Maybe two. 

Tommy John surgery has seemingly reached a point where we expect the pitcher to make a full recovery after 16-18 months. However, shoulder tears are still viewed as the boogey man of injuries. Will this always be the case? Can we expect to reach a point in the (relatively) near future in which pitchers who suffer labrum tears are expected to fully recover?
No. Dr. Neal ElAttrache was on a panel with me this summer and he's the guy for shoulders. (Once, Jim Andrews was asked what the first thing he does when he sees a torn labrum case and he said "call Neal for a consult.") Neal gave a great explanation which might still be up at the SABR site [Ed. Note: Audio of the panel can be found here] - the panel was at their annual convention - about how the shoulder is so complex, that its like putting together a puzzle without the box top. The elbow is a hinge. It moves one way. Look at how many things the shoulder can do and how many structures it takes to do it. Just move your shoulder around and pay attention to what it takes to move through various motions and you'll understand why it’s so tough to get it back to original condition.

26 October 2011

An Interview with an Arm Injury Researcher, Part I


by Will Beaudouin
Will is a freelance writer who has written for Camden Depot previously.

Hayden Penn is now a Chiba Lotte Marines in JPL
Remember how we all used to pencil Chorye Spoone into future Orioles’ rotations? Can you recall the excitement surrounding Hayden Penn after he struck out 120 batters in 110 innings at Bowie? These were guys who were going to anchor the next great pitching staff in Baltimore. Unfortunately, both of their careers were hindered by various arm and shoulder injuries. Penn, along with falling down a set of stairs and being impaled by a broken bat, had elbow issues and went under the knife in 2007. Spoone suffered a labrum tear that appears to have ended any expectation of him becoming a Major League starter. If Penn and Spoone had stayed healthy, who knows what would have happened--it really can’t be over emphasized how important it is to keep your young pitchers healthy. Fortunately, there’s hope on the horizon that pitching injuries, as we know them, could be greatly diminished in the future.

Dr. Glenn Fleisig, research director at the American Sports Medicine Institute, is considered an expert in the field of pitching biomechanics and was kind enough to grant us an interview. At ASMI, Dr. Fleisig works with various pitchers—both professional and amateur—to correct flaws in their pitching mechanics with the ultimate goal of reducing injury. It’s his work that’s giving baseball fans hope that their favorite pitchers may soon have longer, healthier careers. A world in which a pitching prospects future is defined solely by their ability, rather than hearing the constant refrain of TINSTAAP (there is no such thing as a pitching prospect)? I’d take that.

In the past you’ve worked with pitchers from the Mets, A’s, and Red Sox. What sort of information are you able to provide them?  How prevalent is it that teams request services like yours?

Pitchers of all levels – from youth league to Major Leagues – come to ASMI for biomechanical evaluation.  The purpose of the visit is usually two-fold: to minimize the risk of injury and maximize performance.  The pitcher’s biomechanics are compared against elite pitchers previously tested at ASMI and then we use our biomechanics knowledge to identify areas for improvement.  We are pretty much measuring motions and forces such as those discussed in [scholarly research] papers, but explaining it to the pitcher in coach in a much clearer way, with videos, pictures, and descriptions.  You can see what the process looks like at this link.

Several professional teams send players to ASMI, but we do not disclose the names of the teams or players to protect their privacy.  The team or player is welcomed to disclose that they came to ASMI, if they wish.  This is our privacy policy for professionals and for amateurs.

The key to successful evaluation is the coach (pitching coach and strength coach).  The biomechanical analysis is simply an evaluation of what is wrong and what should be fixed.  The evaluation is a diagnostic tool for the coach, as the coach is the one who works with the athlete.  I view this as analogous to an MRI for an injury.  An MRI doesn’t fix an injury; an MRI gives information to the medical professional who is the one who treats the injury.


What’s the future for the field of baseball and biomechanics?

Behind the scenes, many professional teams are now trying to use biomechanics to keep their pitchers healthy and successful.  Some of the teams work with ASMI on this, and others work with our biomechanists.  Biomechanics is helping some teams and some players, and I predict that this effort will continue to grow.  Think of this as “Moneyball, Part 2.”  As you know Michael Lewis’ Moneyball showed how the science of statistical trends can improve the performance of players and teams.  The science of biomechanics is now being used to improve the performance of players and teams.  “Moneyball, Part 2” is actually a very appropriate name for this phenomenon, as the Oakland A’s were the first pro team is use biomechanics as part of their program.  The A’s pitching coach Rick Peterson started bringing pitchers like Barry Zito and Tim Hudson to ASMI in 2002 (the season featured in the Moneyball movie). For more details of how this started in pro baseball, read this old interview.

So, to answer your question, I think biomechanics is being used more by some MLB teams than people realize.  I think the impact will become even greater in the near future.  I think the success depends on the following three issues:

1. The ability of biomechanists to clearly explain findings to coaches.
2. The ability of coaches to make changes in the mechanics of pitchers.
        3. The convenience of biomechanical testing. 

Note: up until now, a pitcher had to come to ASMI for an evaluation.  Pitchers still come to ASMI from all across the country, but ASMI now also has the capability to bring its lab to a team’s spring training facility.

In Part II we’ll talk about specific types of injuries, along with a look into some of Dr. Fleisig’s—and colleagues’—published research.