Showing posts with label DL. Show all posts

16 March 2014

Science of Baseball: Hook of Hamate Fracture in Competitive Baseball Players

Hook of Hamate Fractures in Competitive Baseball Players
Bachoura et al. 2013
Hand

Background

Baseball players are susceptible to a number of specific upper extremity injuries secondary to batting, pitching, or fielding. Fractures of the hook of hamate have been known to occur in batters. The purpose of this study is to present our experience with the surgical management of hook of hamate fractures and their short-term impact on the playing capability of competitive baseball players.

Methods

A retrospective chart review was performed on patients with hook of hamate fractures between the years 2000 and 2012. The inclusion criteria were (1) hook of hamate fracture, (2) competitive baseball players, and (3) surgical treatment of the injury. Patient demographics, mechanism of injury, surgical treatment, and outcome were collected from the medical records. Information on return to play was collected from the Internet when applicable.

Results

There were seven male patients that underwent eight procedures. The mechanism of injury was attributed to batting in six cases and rogue pitches in two cases. All surgeries consisted of hamate hook excision and ulnar tunnel decompression. One patient had concomitant carpal tunnel release. The median time between surgery and return to play was 5.7 weeks (range, 4.3 to 10.4 weeks).

Conclusions

The mechanism of hook of hamate fractures in baseball players is predictable, most often developing secondary to repetitive swinging. This injury may occur at all levels of competition. Ulnar tunnel decompression with hook of hamate excision provides good outcomes, with minimal complications and early return to play.
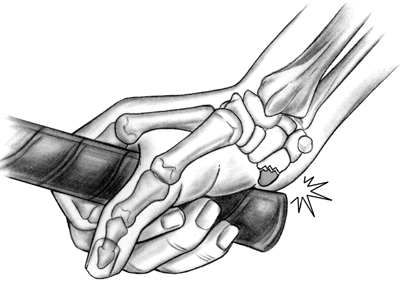
The above study looked at hook of hamate fractures in seven competitive players.  This is the injury that Nick Markakis suffered in May of 2012.  In the study, they looked at seven players ranging from 19 to 26 years old whose level of play ranged from high school to MLB.  One player suffered two breaks that required surgery each time.  Of these total eight incidents, six were the product of swinging while two happened to being hit by a pitch.  Typically treatment involves excision of the hook of hamate and surgically decompression the ulnar tunnel from around the nerve.  All players returned to action within 30 games or were ready for the start of the next season.  Insufficient data was collected to measure impact on power.

----

In general, the injury is often associated with a quick recovery time (about 5 weeks), but players experiencing lingering weakness with respect to generating power in baseball.  The idea being that the hand itself takes time to be able to firmly grasp the handle.  As far as I am aware, there is no comprehensive study of major leaguers who have had the surgery.  There are decent studies looking at amateurs that found similar levels of performance at the end of the rehabilitation time.

Below is a comparison of Markakis' performance before and after his horn of hamate break in 2012 as well as his performance in 2013.


AVG OBP SLG ISO
2012 Before 256 333 452 196

After 335 390 489 154
2013
271 329 356 85
As you can see, his power collapse in 2013 and it did not do that after the hamate break, which suggests all that you have read about that break impacting his power is likely inaccurate.  What is more likely to have impacted Nick was when C.C. Sabathia broke his thumb with a fastball, ending Markakis' season in September.

30 January 2014

In 2013, FA Hitters More Often Hit the DL and Had Worse Injuries than Pitchers

Yesterday, Brewers General Manager Doug Melvin said this on MLB Radio:

It is an interesting statement.  Two out of every three free agent pitcher signings ended up on the DL.  You always need to be aware and cautious.  However, I would challenge a few things with this statement:
  1. I assume all free agent pitchers includes relievers as well as lowly paid starters with enough questions behind them that they have a high fail probability.  If we are talking about a starting pitcher like Garza, do we really want to include all of these other players in the mix.
  2. 67% sounds like a lot, but what is the DL rate of position players?  Did pitchers disproportionately wind up on the DL?
Thankfully, these are all things we can count with ease.  I do need to define a few things though.

Population: I included starting pitchers and position players who either signed a multi-year deal in excess of 10 MM or a single season in excess of 5 MM.  This left me with 16 starting pitchers and 23 position players.
Disabled List: This may not really need to be defined, but I wish to be explicit here.  I am only counting trips officially on the DL and I am not counting a player leaving the team for a funeral, a birth, or some other personal reason.  This may be somewhat unfair as some position players may be able to hide on the bench with an injury while a starting pitcher typically needs to pitch or will go on the DL.  One example of a player who misses a lot of games, but does not find himself on the DL is Marco Scutaro.  Last year, he missed 22 games due to day-to-day issues, but never gave up his active roster spot.

2013 Starting Pitcher Free Agents
Below is the list of pitchers we are including in this post:


PLAYER AGE TEAM YRS DOLLARS DL GAMES
Zack Greinke 30 Dodgers 6 $147,000,000 Y 29
Anibal Sanchez 29 Tigers 5 $80,000,000 Y 24
Edwin Jackson 30 Cubs 4 $52,000,000 N 0
Hyun-Jin Ryu 26 Dodgers 6 $36,000,000 N 5
Ryan Dempster 36 Red Sox 2 $26,500,000 N 0
Jeremy Guthrie 34 Royals 3 $25,000,000 N 0
Brandon McCarthy 30 Diamondbacks 2 $15,500,000 Y 57
Joe Blanton 33 Angels 2 $15,000,000 N 0
Hiroki Kuroda 38 Yankees 1 $15,000,000 N 2
Hisashi Iwakuma 32 Mariners 2 $14,000,000 N 0
Dan Haren 33 Nationals 1 $13,000,000 Y 14
Andy Pettitte 41 Yankees 1 $12,000,000 Y 19
Kevin Correia 33 Twins 2 $10,000,000 N 0
Brett Myers 33 Indians 1 $7,000,000 Y 116
Scott Feldman 30 Cubs 1 $6,000,000 N 0
Scott Baker 32 Cubs 1 $5,500,000 Y 141


On DL 7 44%


>50 games 3 19%


Among these pitchers, only 44% wound up on the disabled list.  That seems to me to be quite a departure from the 67% Melvin cited.  To be fair, I imagine he also included relievers and pitchers below the 5 MM mark.  I think it might be fair to provide some conjecture here.  I would imagine relievers are injured more often than starters because relievers tend to he hard throwing pitchers with violent deliveries.  Those characteristics tend to mean that mechanics are somewhat poor and that probably leads to a higher injury rate.  Additionally, I imagine starting pitchers who fetch less than 5 MM have significant questions attached to them and health might be one of those.

That all said, Melvin made that comment in context with Matt Garza.  That seems to me to be an unfair comparison.  Pitchers who teams think are worth significant contracts tend not to suffer an injury rate as high as the quote suggests.  But, is it high?

2013 Position Player Free Agents
Using the same contract stipulations, here is the position player list:


PLAYER POS AGE NEW TEAM YRS DOLLARS DL Games
Josh Hamilton RF 32 Angels 5 $123,000,000 N 7
B.J. Upton CF 29 Braves 5 $75,250,000 Y 18
Nick Swisher 1B 33 Indians 4 $56,000,000 N 9
Michael Bourn CF 31 Indians 4 $48,000,000 Y 23
Angel Pagan CF 32 Giants 4 $40,000,000 Y 87
Shane Victorino RF 33 Red Sox 3 $39,000,000 Y 34
Torii Hunter RF 38 Tigers 2 $26,000,000 N 4
Cody Ross LF 33 Diamondbacks 3 $26,000,000 Y 56
Adam LaRoche 1B 34 Nationals 2 $24,000,000 N 6
Marco Scutaro 2B 38 Giants 3 $20,000,000 N 22
Russell Martin C 30 Pirates 2 $17,000,000 N 7
Melky Cabrera LF 29 Blue Jays 2 $16,000,000 Y 72
Ryan Ludwick LF 35 Reds 2 $15,000,000 Y 116
Ichiro Suzuki RF 40 Yankees 2 $13,000,000 N 0
Jeff Keppinger 2B 33 White Sox 3 $12,000,000 N 13
Kevin Youkilis 3B 34 Yankees 1 $12,000,000 Y 132
Lance Berkman DH 37 Rangers 1 $11,000,000 Y 52
Jonny Gomes LF 33 Red Sox 2 $10,000,000 N 0
Maicer Izturis 2B 33 Blue Jays 3 $10,000,000 Y 36
Stephen Drew SS 30 Red Sox 1 $9,500,000 Y 25
A.J. Pierzynski C 37 Rangers 1 $7,500,000 Y 14
Mark Reynolds 1B 30 Indians 1 $6,000,000 N 0
Mike Napoli 1B 32 Red Sox 1 $5,000,000 N 6


On DL 12 52%


>50 games 6 26%


For this season, both the percentage of players who spent time on the DL and the percentage of players who spent lengthy stays on the DL were greater than those for pitchers.  The quote now seems to break down on both of the points I suggested.  Of course, this is with my stipulation of only considering players with large investments being made by the team.  In other words, Melvin is probably being 100% truthful, but he may be altering his population to fit his needs.  For instance, it might be more beneficial when talking to an agent to bring up a statistic that suggests that pitchers are incredibly brittle.

Conclusion
All in all, this might be a situation where the cart might be leading the horse.  What I mean to say is that players who appear healthy wind up get a large salary because teams are confidant they will get proper value out of the player.  That probably is not true all of the time, but it likely is a major factor when teams think about how much money to offer.

A second point not explored in this post is what exactly happens after year 1 in a multi-year deal?  We would need more seasons of data, but it would be interesting to see how much value is retained into year 2, 3, 4, and 5 as a contract progresses.  Is there a higher injury rate for pitchers over several years?  Do hitters tend to retain their performance to a higher degree than pitchers.

Regardless, the take home here is that you might want to reconsider repeating Melvin's quote because it certainly appears misleading.


24 January 2013

Can the Orioles Expect to Bounce Back by Being Healthy This Year?

There is a simple phrase going about, "The Orioles were lucky last season."  This in turn has sprouted talk radio segments and internet articles on how the Orioles in fact had bad luck last year, too.  My immediate response is that: (1) The Orioles were lucky in how well they did in games decided by one run by going 29-9 (one run win records are highly variable year to year with no predictability, but typically group around .500--in other words, they performed 10 wins better than expected) and (2) The Orioles' misfortune with injuries was not out of the ordinary.  With that perspective, I find the whole argument insufficient to think the team will bounce back merely due to good health, but that is sort of a lazy way of going about it.  Let us jump into some numbers.

Jeff Sullivan has done a great job with collecting disabled list numbers.  You can find his collected information here on the DL (edit-some of the datai is squirrelly and I used it as is. There needs to be some double checking on it).  How does the AL East look?


Total Consequence
Blue Jays 1431 228
Orioles 1381 109
Rays 987 200
Red Sox 1604 213
Yankees 1753 672
The table above shows the total number of days on the DL spent by players of a specific organization as well as the total number of days spent by players who I deemed as significant losses.  Those lists are certainly arguable:
Blue Jays - Jose Bautista (77), Brett Lawrie (34), J.P. Arencibia (43), Brandon Morrow (74)
Orioles - Nick Markakis (38), Jason Hammel (54), Mark Reynolds (17)
Rays - Evan Longoria (98), B.J. Upton (17), Desmond Jennings (24), Jeff Keppinger (34), Matt Joyce (27)
Red Sox - Jacoby Ellsbury (90), Cody Ross (31), Dustin Pedroia (15), David Ortiz (77)
Yankees - Michael Pineda (183), Brett Gardner (160), Mariano Rivera (153), CC Sabathia (37), Andy Pettite (83), Alex Rodriguez (40), Ivan Nova (17)
I think the only teams where they may be some argument in whether or not I left out a player of consequence would be the Orioles and Red Sox.  I am fairly confidant in those lists those.  For the Orioles, Zach Britton and Nolan Reimold are missing.  Britton's issues with control and Reimold's history (along with McLouth's emergence) cast doubt on how meaningful those absences really were.  I'm not sure Britton's absence is all that much different from the Blue Jays missing Dustin McGowan or the Rays missing Jeff Niemann and Jeremy Hellickson.

For the Red Sox, I decided not to include Carl Crawford, John Lackey, Josh Beckett, Kevin Youkilis, and Felix Doubront.  The first four names are big names and the last is a younger player who shows good potential.  However, I think there is a good argument to suggest that these players may not have added much to the team.  I am still a Carl Crawford believer (though not at that money) and the Yankees think Youkilis is a good player to have around (evidenced by the contract he received for the upcoming year).


Back to the table above, I think there are a couple ways to look at it.  One, looking at the overall numbers, the Orioles appear to be not much different from the rest of the division on average (1431 days), so it is difficult to say they suffered extraordinary through DL visits on that point.  When you look at the number of days lost to the absence of players of consequence, the Orioles actually appear quite lucky in comparison to the other teams.  If you add in Reimold and Britton along with the other teams adding in their arguably marginal talent, you get the follow table for DL days:


Loose
Blue Jays 411
Orioles 447
Rays 324
Red Sox 594
Yankees 672
The average above is 490 days.  Again, nothing seems incredibly unique about the number of days lost to injury for the Orioles.  Health alone does not seem to be something the Orioles suffered worse for than the other teams in the division.

In the end, I think the hope for next year is that somehow two months of play from Chris Tillman, Miguel Gonzalez, Nate McLouth, and Manny Machado will somehow be extrapolated over the course of an entire season.  If that happens, it adds about 8 or 9 wins to the team.  So, yes, if you believe those four are real and the performances of the others on the team can be repeated as well as the club not suffering more significant injuries than they suffered last year (as opposed to the Rays, Blue Jays, Yankees, and Red Sox who lost top tier elite players over large swaths of the season)...then, yes, the Orioles could repeat their success seen in 2012 for 2013 without fortune smiling on them in one run games.