22 November 2013

2013 Strikezone Analysis: Teams Summary

As previously discussed, the strikezone was called very consistently over the course of the 2013 season. However, that does not mean that there was not some variation of the strikezone for different teams, acknowledging small sample size caveats for teams outside of the American League East.

Over the course of the season, there is no statistical correlation between call differential, (O's BcS + Opps. ScB) - (O's ScB + Opps. BcS), and run differential. The correlation coefficient is just .0099.

(Note: BcS are balls called strikes and ScB are strikes called balls.)


On the surface, the "Yankee Strikezone" appears to exist (as well as a "Rays Strikezone"). Each one of the American League East teams will receive a more detailed write-up later. Below are samples of the overall season data for the Orioles against each opponent.

21 November 2013

Concussions in 2013: A Brief Overview

While sports such as football, hockey, and soccer bear the brunt of most of the concerns and outrage over player concussions, baseball does have its share of the injury, in spite of its reputation as a non contact sport. In particular, catcher concussions appear to be on the rise in recent years; however, they are not limited to just those who wear the tools of ignorance, as the injuries to Tampa Bay Rays pitcher Alex Cobb and Baltimore Orioles second baseman Alexi Casilla this past season can attest. Despite the plethora of statistics in the game, the publicly available data detailing the incidence of concussions and even head injuries in general is scant, with most of it dedicated to catcher concussions. When data from collegiate and youth baseball circles are included, we still find that catastrophic head injuries are rare, but that concussive injuries arising from contact with another player, ball, bat, ground, or base are the most common of head and face injuries sustained on the playing field.

Part of a long list of maladies whose long term effects remain poorly understood in the neurological world, a concussion is defined as a complex process involving the brain secondary to trauma; this trauma can be a direct blow to the head or neck or something that is transmitted to the head from elsewhere in the body. As a result, a rapid onset of impaired neurologic function occurs, sometimes with a loss of consciousness, but often without impaired consciousness. Symptomatically, a person who has sustained a concussion can suffer from deficits in emotional, cognitive, and physical function that will typically resolve in a short period of time, on the order of seven to ten days; while not as common, concussive symptoms can persist for months or even remain permanently. For a more detailed description of what is commonly encountered symptom-wise by those felled by a concussion, John Sickels has a fantastic account of his own struggles with concussive symptoms that you can find here, with the caveat that the symptoms he describes are not exhaustive. A list of the more frequently encountered symptoms at presentation of a concussion are provided below:

Signs and symptoms of a concussion, courtesy of cdc.gov.

A systematic approach is taken when evaluating a player who is believed to have suffered a concussion, with a medical professional on hand to witness the injury ideal in order for a rapid response to be undertaken. Initial assessments are comprised of the basic ABCs of medical emergencies -- airway, breathing, and circulatory processes and fitness being evaluated. If a player is not in any sort of immediate distress related to their breathing or blood circulation, then evaluations to determine if they have lost consciousness or otherwise compromised neurologically are begun, with particular attention paid to the potential for spinal injury. Once cleared, the focus is then turned to getting the player off of the field in order to perform a thorough evaluation and use of an assessment tool to acquire data to evaluate the concussion, such as memory assessments. Questions related to a player's ability to orient themselves to place and time are older and more widely known methods of evaluation, but have been found to be unreliable compared to memory testing. There are multiple forms of memory tests, but recent changes to MLB policies related to concussive injuries included the formal adoption of the SCAT2 -- Sport Concussion Assessment Tool, version 2 -- which assesses a player's current symptoms in relation to their symptom severity while also focusing on physical and cognitive function post-injury. With SCAT2 results, medical staff can better determine the proper disposition plans for a player and whether more rigorous evaluations and interventions are warranted for management and treatment of the concussion.

2013 saw 20 concussions suffered by 19 players, up from 13 suffered in 2012. As expected, catchers dominated the data, accounting for 58% of the players and 60% of the 450 games lost due to concussion:

Player Team Games Lost Position Career Concussions*
Wilkin Ramirez Twins 69 LF 1
David Ross** Red Sox 68 C 3
John Jaso Athletics 60 C 1
Alex Cobb Rays 51 P 1
Joe Mauer Twins 39 C 1
Max Stassi Astros 30 C 1
Carlos Corporan Astros 19 C 1
Austin Romine Yankees 17 C 2
Alex Avila Tigers 16 C 1
Justin Maxwell Astros 12 OF 1
Domonic Brown Phillies 11 OF 1
Placido Polanco Marlins 10 3B 2
Ryan Doumit Twins 8 C 6
Yorvit Torrealba Rockies 8 C 1
Stephen Drew Red Sox 7 SS 1
Trevor Plouffe Twins 7 3B 1
Salvador Perez Royals 7 C 1
Alexi Casilla Orioles 6 2B 1
Didi Gregorius Diamondbacks 5 SS 1
* information courtesy of baseballprospectus.com; includes MLB and MILB data
** Ross' 69 games lost to concussion are from two concussions suffered in 2013


Along with the catcher leanings, we also see a few repeat offenders, with four of the 19 players of 2013 having previously suffered a concussion in either MLB or MILB play, with Minnesota Twins receiver Ryan Doumit suffering a shocking six concussions as a professional.

Let's now briefly discuss the effects of the concussion on our concussed players. In the following graphs, we will look at pre and post concussion data for those players who sustained a concussion during the season and returned to play afterwards. For this exercise, we have 12 players' data, with the remaining eight players sustaining concussions that ended their 2013 season:


First, position players and the difference in OPS pre and post concussion:

For this chart, we find that five players performed worse post-concussion, with Boston Red Sox catcher David Ross being an interesting case study, given his suffering two concussions last year.

Since we do have a pitcher in our data, this next chart describes pre and post injury RE24 differences, with negative values meaning that the player performed worse (per RE24) after returning from concussion:


Again, we don't see a drastic difference in the number of positive/negative performances after concussion, but we do see that the effects of the injury were significant to the production of Twins' Trevor Plouffe and Philadelphia Phillies' Domonic Brown, with two catchers -- Salvador Perez and Alex Avila -- actually playing better post injury. Why this trend is seen is no clear and additional data would be necessary to parse out whether this 'improvement' is significant.


...and last, the number of games played pre and post injury for each player to reference when looking at the OPS and RE24 data:


Much has been done in the last couple of years to better evaluate and treat concussions in baseball; in spite of these interventions, we find not only an increase in the number of concussions suffered, but tangible evidence of the effects the injury can have on the play of those afflicted. While there still remains much to be learned and researched with respect to the long term effects of concussions on players, the data as presented shows that while the raw number of injuries sustained in baseball is not extravagant as compared to other sports, the need for increased awareness and vigilance of concussions is warranted.


***
All data courtesy of Baseball-Reference.com unless otherwise noted.

Reference: Dines, JS, Altchek, DW, Andrews, JR, ElAttrache, NS, Wilk, KE, Yocum, LA. (2012) Sports Medicine of Baseball: Philadelphia, PA.

20 November 2013

Chris Tillman: Pitch Location and Sequencing with Men on Base and Bases Empty

Back in July, I had an idea.  I noticed that in a few games that Chris Tillman seemed to freely challenged hitters with high fastballs with no one on base, but tended to stay down in the zone otherwise.  If this was true, it would potentially explain why he tended to give up a lot of solo home runs and suggest that fWAR would consistently undervalue him by overvaluing the home runs against him.  I had Nate Delong work his trade to discern if there truly were any differences.  What he found was that Tillman did not avoid high fastballs with men on base, but was certainly reluctant in his use of high heat in comparison to when the bases were empty.

In early October, I noticed an excellent article by Matthew Mata on the Fangraphs Community page on pitch sequencing.  With a full season of Tillman's pitching to use, I asked Mata to go in a little deeper to see what could be said about Tillman's pitching, sequencing, and impact of men on base.  Get yourself a coffee, a pen and paper for notes, and enjoy.


-----

For Chris Tillman's 2013 season, his pitch locations can be split into the cases of “Runners On” and “Bases Empty”, and “versus LHB” and “versus RHB”. For each of the four combinations, the locations can be displayed using a heat map to show the most frequented areas in and around the strike zone. For the heat maps, each pitch is represented by a baseball-sized spot of value one, so the color indicates how many pitches overlap at that location.

Since the heat map is from the catcher's perspective, left-handed batters will be to the right of the strike zone, and right-handed batters to the left. In the above case, most of Tillman's pitches to lefties with the bases empty are toward the outer half of the plate with the number of pitches dropping off in the periphery of the strike zone. When runners are on, the data looks similar albeit with fewer pitches:


With runners on, Tillman concentrated his pitches slightly more low and away than when the bases were empty. Also of note is that the majority of Tillman's pitches with runners on are at or below four feet, as compared to five feet with no one on base. However this effect may be just due to a smaller number of pitches made with baserunners. In both cases, most pitches are, horizontally, in between two feet to the left and one foot to the right of the center of home plate. However, when we examine the case of Tillman facing righties, the story is quite different.


When the basepaths are empty, the outer half of the strike zone is very much similar to a mirror image of the data for left-handed batters. However, the pitch distribution at the inner edge of the strike zone cuts off abruptly, with very few inside pitches to righties. In fact, it appears to cut off a few inches into the strike zone, with a noticeable blue area just inside the left side, indicating a lack of pitches in that area. This can again be compared to the case with baserunners to see if the result is related to this particular state or is a lefty/righty phenomenon.

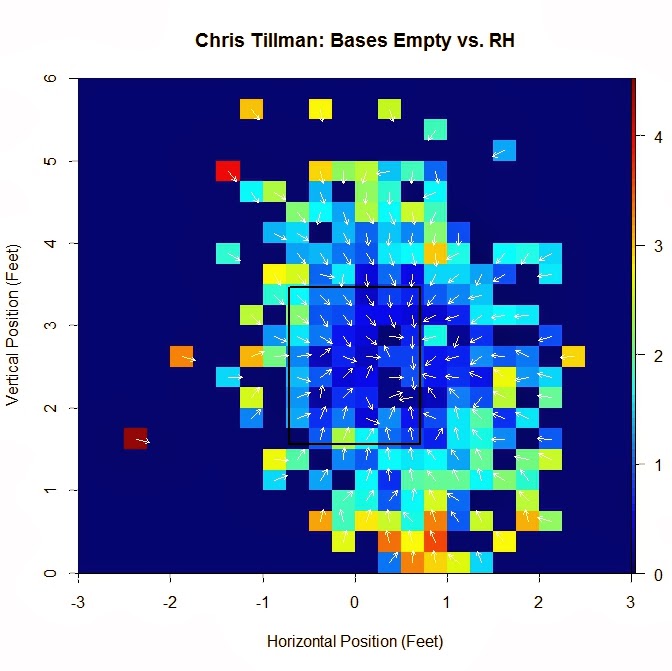
As illustrated by the plot, Tillman does not avoid pitching inside with runners on base. Focusing on the results for RHB, a deeper analysis can be employed to look at possible causes. To examine this, the location of subsequent pitches in an at-bat can be averaged to try to get an idea of his pitching style against righties. In the plot below, pitches are sorted into three-inch by three-inch bins and for each of the pitches in a given bin, the location of the subsequent pitches are averaged to give an average direction and distance of the next pitch (the direction is represented by the arrows and the average distance by the heat map).
With the bases empty, for pitches throughout most of the strike zone, the subsequent pitch is, on average, directed away from the batter. This would indicate that Tillman is, in general, pitching progressively away from RHB in this scenario. Note that for the few pitches thrown on the left edge of the strike zone, the average subsequent pitch is around 1.5 and 2.5 feet to the right. Also, along the right edge of the strike zone, rather than directed inward toward the center of the zone, the subsequent pitches are staying along that edge, with the arrows on either side pointing inward toward it. Putting these observations together, Tillman is pitching toward and then staying along the outside edge to righties. Compare this to the case with runners on:

With runners on, the left side of the strike zone is a bit more chaotic with less of an overall preferred direction. Also, the observed behavior along the right side is no longer present. So it would seem that when the bases are empty, Tillman is progressively pitching away from RHB, leading to a dearth of inside pitches. To see if this is normal for pitchers against same-sided batters or if Tillman is just an outlier, we can define an “inside pitch” to be a pitch for which the baseball lies completely to the batter's side of a vertical line that lies atop the edge strike zone on the side closest to the batter. Working with this definition, with the bases empty, Tillman threw 2.2% of his pitches inside, compared to 12% for runners on.

To get a better picture of how this compares to other pitchers in similar situations, we can take a sample of the fifty RHP that threw the most pitches in 2013, of which Chris Tillman ranks fifth (behind Verlander, Shields, Wainwright, and Dickey). We can plot the data and compute a regression line to get an idea of how the two percentages are related. The players are associated with their data by first initial and last name. The two lines running across the plot are the regression line, in black, for the data and the red line corresponding to inside pitch percentage with bases empty (B.E.P.) equal to inside pitch percentage with runners on (R.O.P.). The latter is included as a reference point to make it easier to discern which pitchers pitch more inside in which scenario.


Surprisingly, the fifty pitchers in the sample are, if only slightly, more likely to pitch inside with runners on. The regression line has slope 0.909 and intercept 0.028 with correlation coefficient, 0.767. Picking out Tillman in this plot is not hard, as he is isolated on the left-hand side. While his percentage of inside pitches with runners on fits well among the other 49 pitchers in the sample, he is dead last in the percentage with bases empty. Considering that the next closest is Hisashi Iwakuma at 4.7%, Tillman appears to be an outlier. While pitchers in the sample tend to have more room for variation above the regression line (e.g., Kennedy, Samardzija, Parker), their percentages for both are much higher than Tilllman.

We can perform a similar study on LHP versus LHB. For left-handed pitchers, there are a few more in the “less than 5% pitches inside” range for bases empty. However, these pitchers seem to rarely pitch inside to same-sided batters, regardless of the situation. Excluding Jeff Locke, the other lefties are all in the range of less than 20% pitches inside to LHB for both bases empty and runners on. Among these fifty lefties, we again do not have a pitcher similar to Tillman, who seemingly pitches inside to same-sided batters only with runners on.


To see the effects of pitching in this manner, we can examine the results of Tillman's season. Looking at several of his statistical categories against for 2013:


LHB/EMPTY
RHB/EMPTY
LHB/ON BASE
RHB/ON BASE
AB
295
195
146
128
1B
45
25
23
18
2B
13
10
6
8
3B
2
0
1
0
HR
11
12
8
2
BB
21
17
19
11
HBP
1
0
1
1
K
59
53
34
33
AVG
.241
.241
.260
.219
OBP
.293
.302
.343
.280
SLG
.410
.477
.479
.328

Note that Tillman achieved his highest strikeout rate against righties with the bases empty, with 53 strikeouts in 195 at-bats. He also fared worse in all three triple slash categories, relative to the case with men on base. It would seem that, for Tillman, not pitching inside to same-side batters in these situations did not have a benefit.

Summarizing, Chris Tillman showed a reluctance to pitch inside to RHB with the bases empty. In fact, when examining his pitch sequences, he pitched, on average, progressively away from them, with most subsequent pitches headed toward the outside edge of the strike zone. While this led to a slightly higher K rate than with runners on, he ceded a HR/AB rate that was over four times higher and over 170 points more of OPS. Whether this pitching style was deliberate or not, it did not lead to better results against righties and was atypical within the one hundred pitchers studied from 2013.

19 November 2013

Chris Young: Starting Left Fielder?

Chris Young robbing a home run (Photo Credit: Dinur Blum)
Last month, during the “Making the Orioles a Champion in 2014” series here at the Depot, Matt did an excellent job of looking at potential options to fill the open space commonly referred to as left field on the 2014 Orioles roster.  One name that I thought warranted consideration, but was missing from the discussion, was (former) Oakland Athletics outfielder Chris Young.  The Athletics declined an $11 million team option on Young earlier in the offseason, making him a free agent.

Reading the title of this post the way Ron Burgundy reads a teleprompter should give a better idea of the starting point of this article, because in all honesty, I’m not sure if the Orioles should attempt to make Young their starting left fielder in the 2014 season.  After accumulating more than 10 Wins Above Replacement (according to Fangraphs) from 2010 to 2012, Young easily had the worst season of his career in 2013 playing mostly as a 4th outfielder in Oakland, collecting only 375 plate appearances. 


Despite the terrible 2013 season, Young will be playing the 2014 season at 30 years old.  So while he may be past his peak, his 2013 numbers aren’t necessarily indicative of his performance going forward.  That’s the good news.  The bad news is that knowing this, Young will want to re-establish his value in the upcoming season, preferring to play for a team that will give him playing time as a starter (such as the Mets, Astros, etc.).  With that in mind, let’s see if the Orioles should pursue Young to fill their starting left field vacancy for the 2014 season.

Let’s start with the tools.  Out of the 5 tools available to a baseball player, Young possesses about 3.5 of them.  He has plus speed, defense, and power.  On the other hand, his arm is ok, and (as you can see by his batting averages above), he can have trouble making good contact.  Young’s inability to hit enough for him to get to his power is really the main hole in his game.

My initial assumption prior to looking at any data was that the main reason Young hits so poorly is due to his high strikeout rate.  However, after looking closer at the numbers, Young’s career strikeout rate, while higher than the league average, is only at 22.9%.  Since 2007 (when Young became a major league regular), the league average strikeout rate has been 18.5%.  So while it’s higher than average, it’s not so astronomical that it should be viewed as an issue.  Additionally, the Orioles had the 8th lowest strikeout rate as a team in 2013, so strikeouts were not generally an overall problem for Baltimore’s offense in 2013.

While his strikeout rate doesn’t help, it seems that the main reason Young perennially hits for low averages deals with his extremely high fly ball rate.  A high fly ball rate isn’t necessarily a bad thing for a hitter with Young’s power, especially if he’s playing most of his games in a ballpark like Camden Yards.  But the issue isn’t just his fly balls.  The issue is the number of infield fly balls he hits, which (obviously) have zero chance of ever being home runs.  While this is not ideal, Young has succeeded with a high IFFB% in previous years (over 20% in 2011), but that’s not a characteristic you generally want in a player.


The fact that Young hits far more fly balls than the average major leaguer means that his batting average is less dependent on BABIP, and as one would expect his career BABIP sits at .274 (league average BABIP in 2013 was .297).  And although his offensive production in 2013 was especially bad, some of it may have been driven by a career low BABIP of .237, despite a line drive rate that was 3% higher than his career average (his FB% and IFFB% in 2013 was only slightly higher than career levels).

On the plus side, Chris Young provides a good approach at the plate with plus power.  He boasts a career walk rate of 10%, which is better than every Orioles hitter in 2013 (minimum 300 PA’s), except for Chris Davis.  His career ISO of .196 would have been 3rd on the 2013 Orioles, (way) behind Davis and just behind Adam Jones.  Young produces a lot of value on the bases and on defense as well.  While he doesn’t steal a ton of bases (career SB% of 76%), he’s graded out as an above average baserunner every year of his career (according to Fangraphs).  On defense, he has a career UZR/150 of 3.0 (mostly in CF) along with 32 Defensive Runs Saved above average.  Ignoring the fact that Young should probably play centerfield instead of Jones based on his defense, he’ll be a more than adequate fill-in should Adam Jones get hurt.

But that’s all in the past, and we’re interested in what Young will produce in 2014.  He should be a relatively cheap signing this offseason.  Jim Bowden of ESPN expects Young to receive a 1 year, $5 million contract, while the Fangraphs audience expects Young to get 2 years and $13.6 million total.  I agree more with Bowden in this case, as I expect Young to prefer a one year contract, so he can re-establish his value and cash in next offseason.

An easy way to get an idea of what Young may contribute in 2014 season is to take a look at his Steamer projections located at Fangraphs.


As you can see in the table, I’ve included the 2014 Steamer projections for Nate McLouth as well, since it has been rumored that the Orioles would like to re-sign McLouth to play left-field for them again next season.  From an offense and baserunning perspective, Steamer projects Young and McLouth to be equally productive.  However, Young gains extra value from his superior defensive skills (both UZR/150 and DRS have McLouth as a below average fielder over his career, and he projects more of the same in 2014).  What is interesting is that Young projects to produce 0.5 wins more than McLouth in 66 fewer plate appearances.  Just for fun, I’ve included the average league production from left field in the 2013 season, and both candidates basically project to be that “average” player.

So what are we left with?  Despite the similarities, we’re left with a few differences that could sway our decision.  The first is Young’s superior defense, which we’ve already touched on.  Next would be each player’s contract expectations.  It’s been reported that McLouth is seeking a 2 year agreement (it’s also been reported that this isn't what the Orioles want to give him), while it’s viewed that Young will be likely looking for a one year contract.  Finally, there is each player’s age, as Young will play the 2014 season at age 30, while McLouth will do so at 32.

In my mind, all of the differences outlined above show Young as the better option in left field for the 2014 season.  Additionally, with a little positive regression (i.e., good luck), it’s not improbable that Young could provide an offensively similar season to the one he produced in 2010.  On the other hand, the best-case scenario for McLouth may very well be a repeat of his production in 2013.

In a perfect world, the Orioles would sign both players, which would give them a very productive LF platoon (Young has a career wOBA of .364 against LHP, while McLouth has a career .342 wOBA against RHP).  Unfortunately, this is not a perfect world, as playing time expectations of the players and payroll limitations of the team make that idea virtually impossible.

Ultimately, the Orioles should roll the dice with Chris Young, assuming he is willing to play left field.  The team will also have to provide Young with the assurance that he’ll be a starter.  And if the Orioles do in fact attempt to sign him, that may be the real challenge.  In a year where he will be looking to re-establish his market value, playing time, specifically in center field, may be the most important factor in Chris Young’s decision.