In early October, I noticed an excellent article by Matthew Mata on the Fangraphs Community page on pitch sequencing. With a full season of Tillman's pitching to use, I asked Mata to go in a little deeper to see what could be said about Tillman's pitching, sequencing, and impact of men on base. Get yourself a coffee, a pen and paper for notes, and enjoy.
-----
For Chris
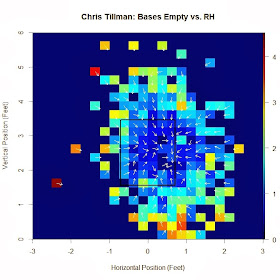
Tillman's 2013 season, his pitch locations can be split into the cases of
“Runners On” and “Bases Empty”, and “versus LHB” and “versus RHB”. For each of
the four combinations, the locations can be displayed using a heat map to show
the most frequented areas in and around the strike zone. For the heat maps,
each pitch is represented by a baseball-sized spot of value one, so the color
indicates how many pitches overlap at that location.
Since the heat map is from the catcher's perspective,
left-handed batters will be to the right of the strike zone, and right-handed
batters to the left. In the above case, most of Tillman's pitches to lefties
with the bases empty are toward the outer half of the plate with the number of
pitches dropping off in the periphery of the strike zone. When runners are on,
the data looks similar albeit with fewer pitches:
With runners on, Tillman concentrated his pitches slightly more low and away than when the bases were empty. Also of note is that the majority of Tillman's pitches with runners on are at or below four feet, as compared to five feet with no one on base. However this effect may be just due to a smaller number of pitches made with baserunners. In both cases, most pitches are, horizontally, in between two feet to the left and one foot to the right of the center of home plate. However, when we examine the case of Tillman facing righties, the story is quite different.
When the basepaths are empty, the outer half of the strike zone is very much similar to a mirror image of the data for left-handed batters. However, the pitch distribution at the inner edge of the strike zone cuts off abruptly, with very few inside pitches to righties. In fact, it appears to cut off a few inches into the strike zone, with a noticeable blue area just inside the left side, indicating a lack of pitches in that area. This can again be compared to the case with baserunners to see if the result is related to this particular state or is a lefty/righty phenomenon.
To get a better picture of how this compares to other pitchers in similar situations, we can take a sample of the fifty RHP that threw the most pitches in 2013, of which Chris Tillman ranks fifth (behind Verlander, Shields, Wainwright, and Dickey). We can plot the data and compute a regression line to get an idea of how the two percentages are related. The players are associated with their data by first initial and last name. The two lines running across the plot are the regression line, in black, for the data and the red line corresponding to inside pitch percentage with bases empty (B.E.P.) equal to inside pitch percentage with runners on (R.O.P.). The latter is included as a reference point to make it easier to discern which pitchers pitch more inside in which scenario.
Surprisingly, the fifty pitchers in the sample are, if only slightly, more likely to pitch inside with runners on. The regression line has slope 0.909 and intercept 0.028 with correlation coefficient, 0.767. Picking out Tillman in this plot is not hard, as he is isolated on the left-hand side. While his percentage of inside pitches with runners on fits well among the other 49 pitchers in the sample, he is dead last in the percentage with bases empty. Considering that the next closest is Hisashi Iwakuma at 4.7%, Tillman appears to be an outlier. While pitchers in the sample tend to have more room for variation above the regression line (e.g., Kennedy, Samardzija, Parker), their percentages for both are much higher than Tilllman.
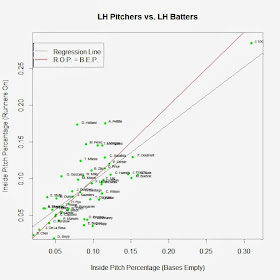
We can
perform a similar study on LHP versus LHB. For left-handed pitchers, there are
a few more in the “less than 5% pitches inside” range for bases empty. However,
these pitchers seem to rarely pitch inside to same-sided batters, regardless of
the situation. Excluding Jeff Locke, the other lefties are all in the range of
less than 20% pitches inside to LHB for both bases empty and runners on. Among
these fifty lefties, we again do not have a pitcher similar to Tillman, who
seemingly pitches inside to same-sided batters only with runners on.
To see the effects of pitching in this manner, we can examine the results of Tillman's season. Looking at several of his statistical categories against for 2013:
LHB/EMPTY
|
RHB/EMPTY
|
LHB/ON BASE
|
RHB/ON BASE
|
|
AB
|
295
|
195
|
146
|
128
|
1B
|
45
|
25
|
23
|
18
|
2B
|
13
|
10
|
6
|
8
|
3B
|
2
|
0
|
1
|
0
|
HR
|
11
|
12
|
8
|
2
|
BB
|
21
|
17
|
19
|
11
|
HBP
|
1
|
0
|
1
|
1
|
K
|
59
|
53
|
34
|
33
|
AVG
|
.241
|
.241
|
.260
|
.219
|
OBP
|
.293
|
.302
|
.343
|
.280
|
SLG
|
.410
|
.477
|
.479
|
.328
|
Note that Tillman achieved his highest strikeout rate
against righties with the bases empty, with 53 strikeouts in 195 at-bats. He
also fared worse in all three triple slash categories, relative to the case
with men on base. It would seem that, for Tillman, not pitching inside to
same-side batters in these situations did not have a benefit.
Summarizing,
Chris Tillman showed a reluctance to pitch inside to RHB with the bases empty.
In fact, when examining his pitch sequences, he pitched, on average,
progressively away from them, with most subsequent pitches headed toward the
outside edge of the strike zone. While this led to a slightly higher K rate
than with runners on, he ceded a HR/AB rate that was over four times higher and
over 170 points more of OPS. Whether this pitching style was deliberate or not,
it did not lead to better results against righties and was atypical within the
one hundred pitchers studied from 2013.


you're crazy but I admire you,guy
ReplyDeleteI'm going to read it!